Generative AI Features
The ScaleOut Active Caching Management UI provides a set of optional generative AI features. These features allow you to get intelligent answers about your modules and generate data views efficiently with natural language prompts.
Enabling and Disabling Generative AI
Important
ScaleOut Active Caching connects to the OpenAI API to provide AI content. To use the optional generative AI features, you must provide your own OpenAI API key. You can create a key at https://platform.openai.com. If you choose to enable AI features and provide your API key, you are responsible for monitoring your key’s usage, security, and any associated costs for API use. See our terms of use and privacy policy documents for more details.
To enable generative AI features, first ensure you are logged in with an administrator account. Navigate to Account & Settings, then choose Connected Services.
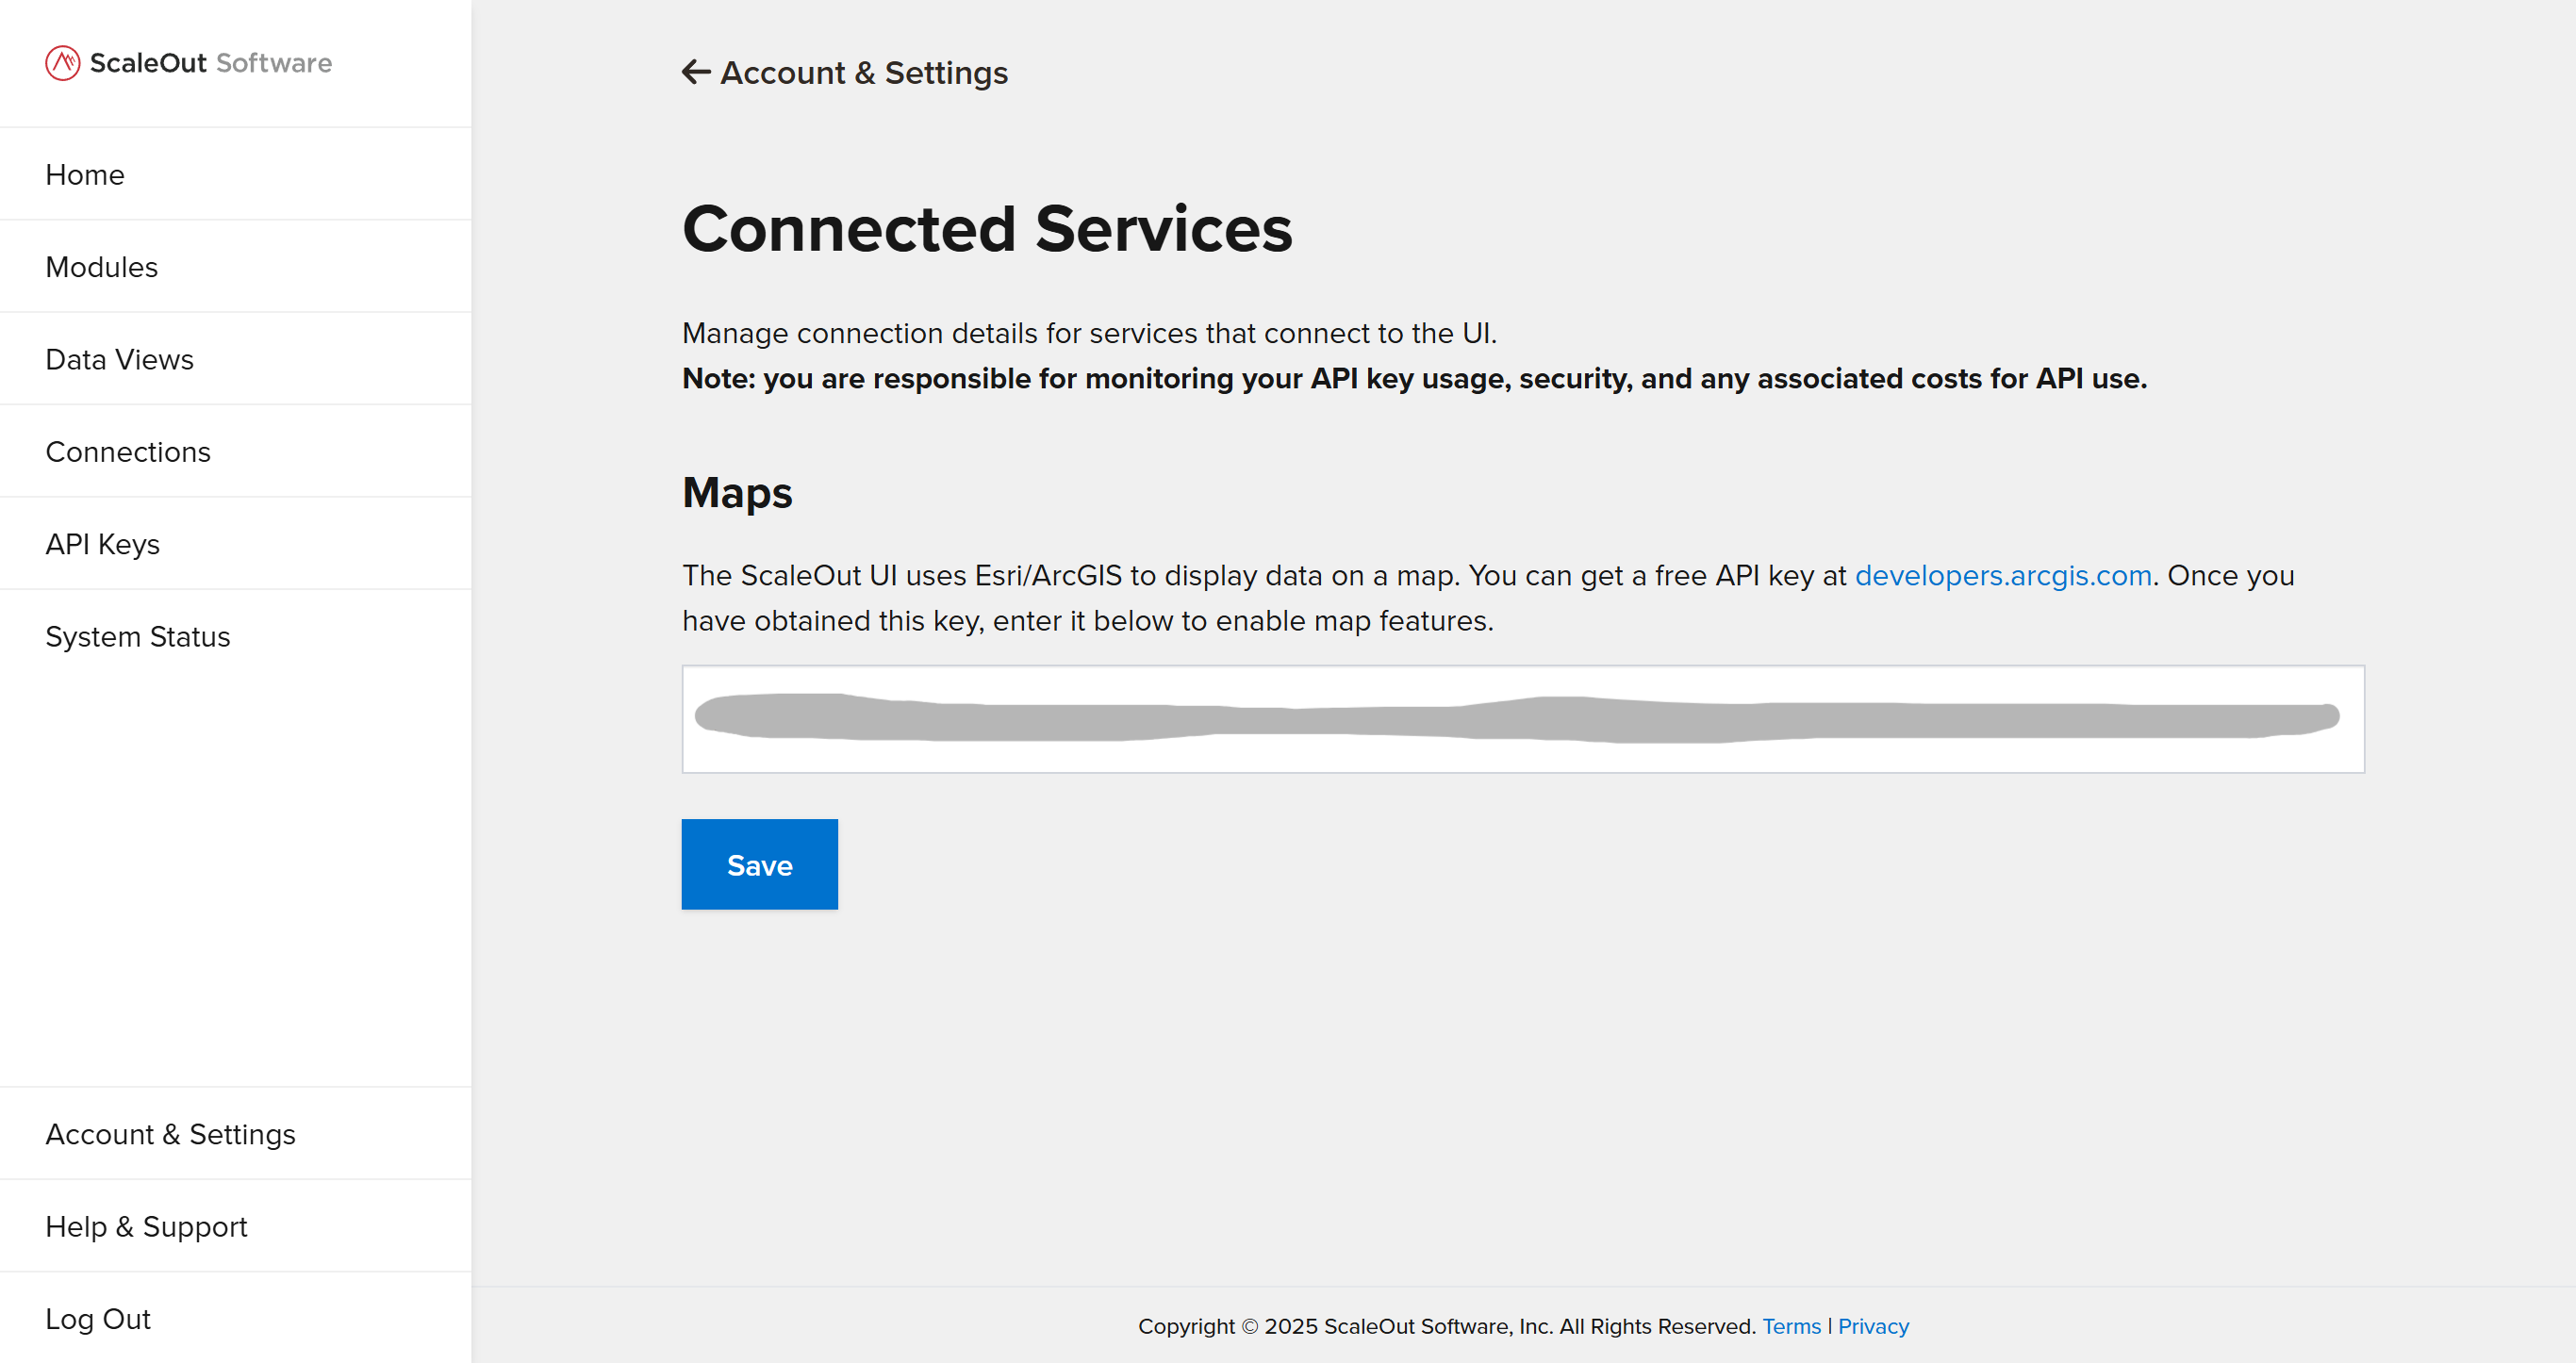
In the Generative AI section, check the Enable generative AI checkbox. If this is the first time you are activating AI features, accept the terms by checking the box in the popup window. Paste your OpenAI API key into the OpenAI API Key field, then click the Save button. AI features will now be available throughout the UI.
Disabling Generative AI
You can disable AI features at any time by going to Account & Settings > Connected Services and unchecking the Enable generative AI box. To remove your API key from the system, simply delete it from the OpenAI API Key field and click Save.
Using AI Chat
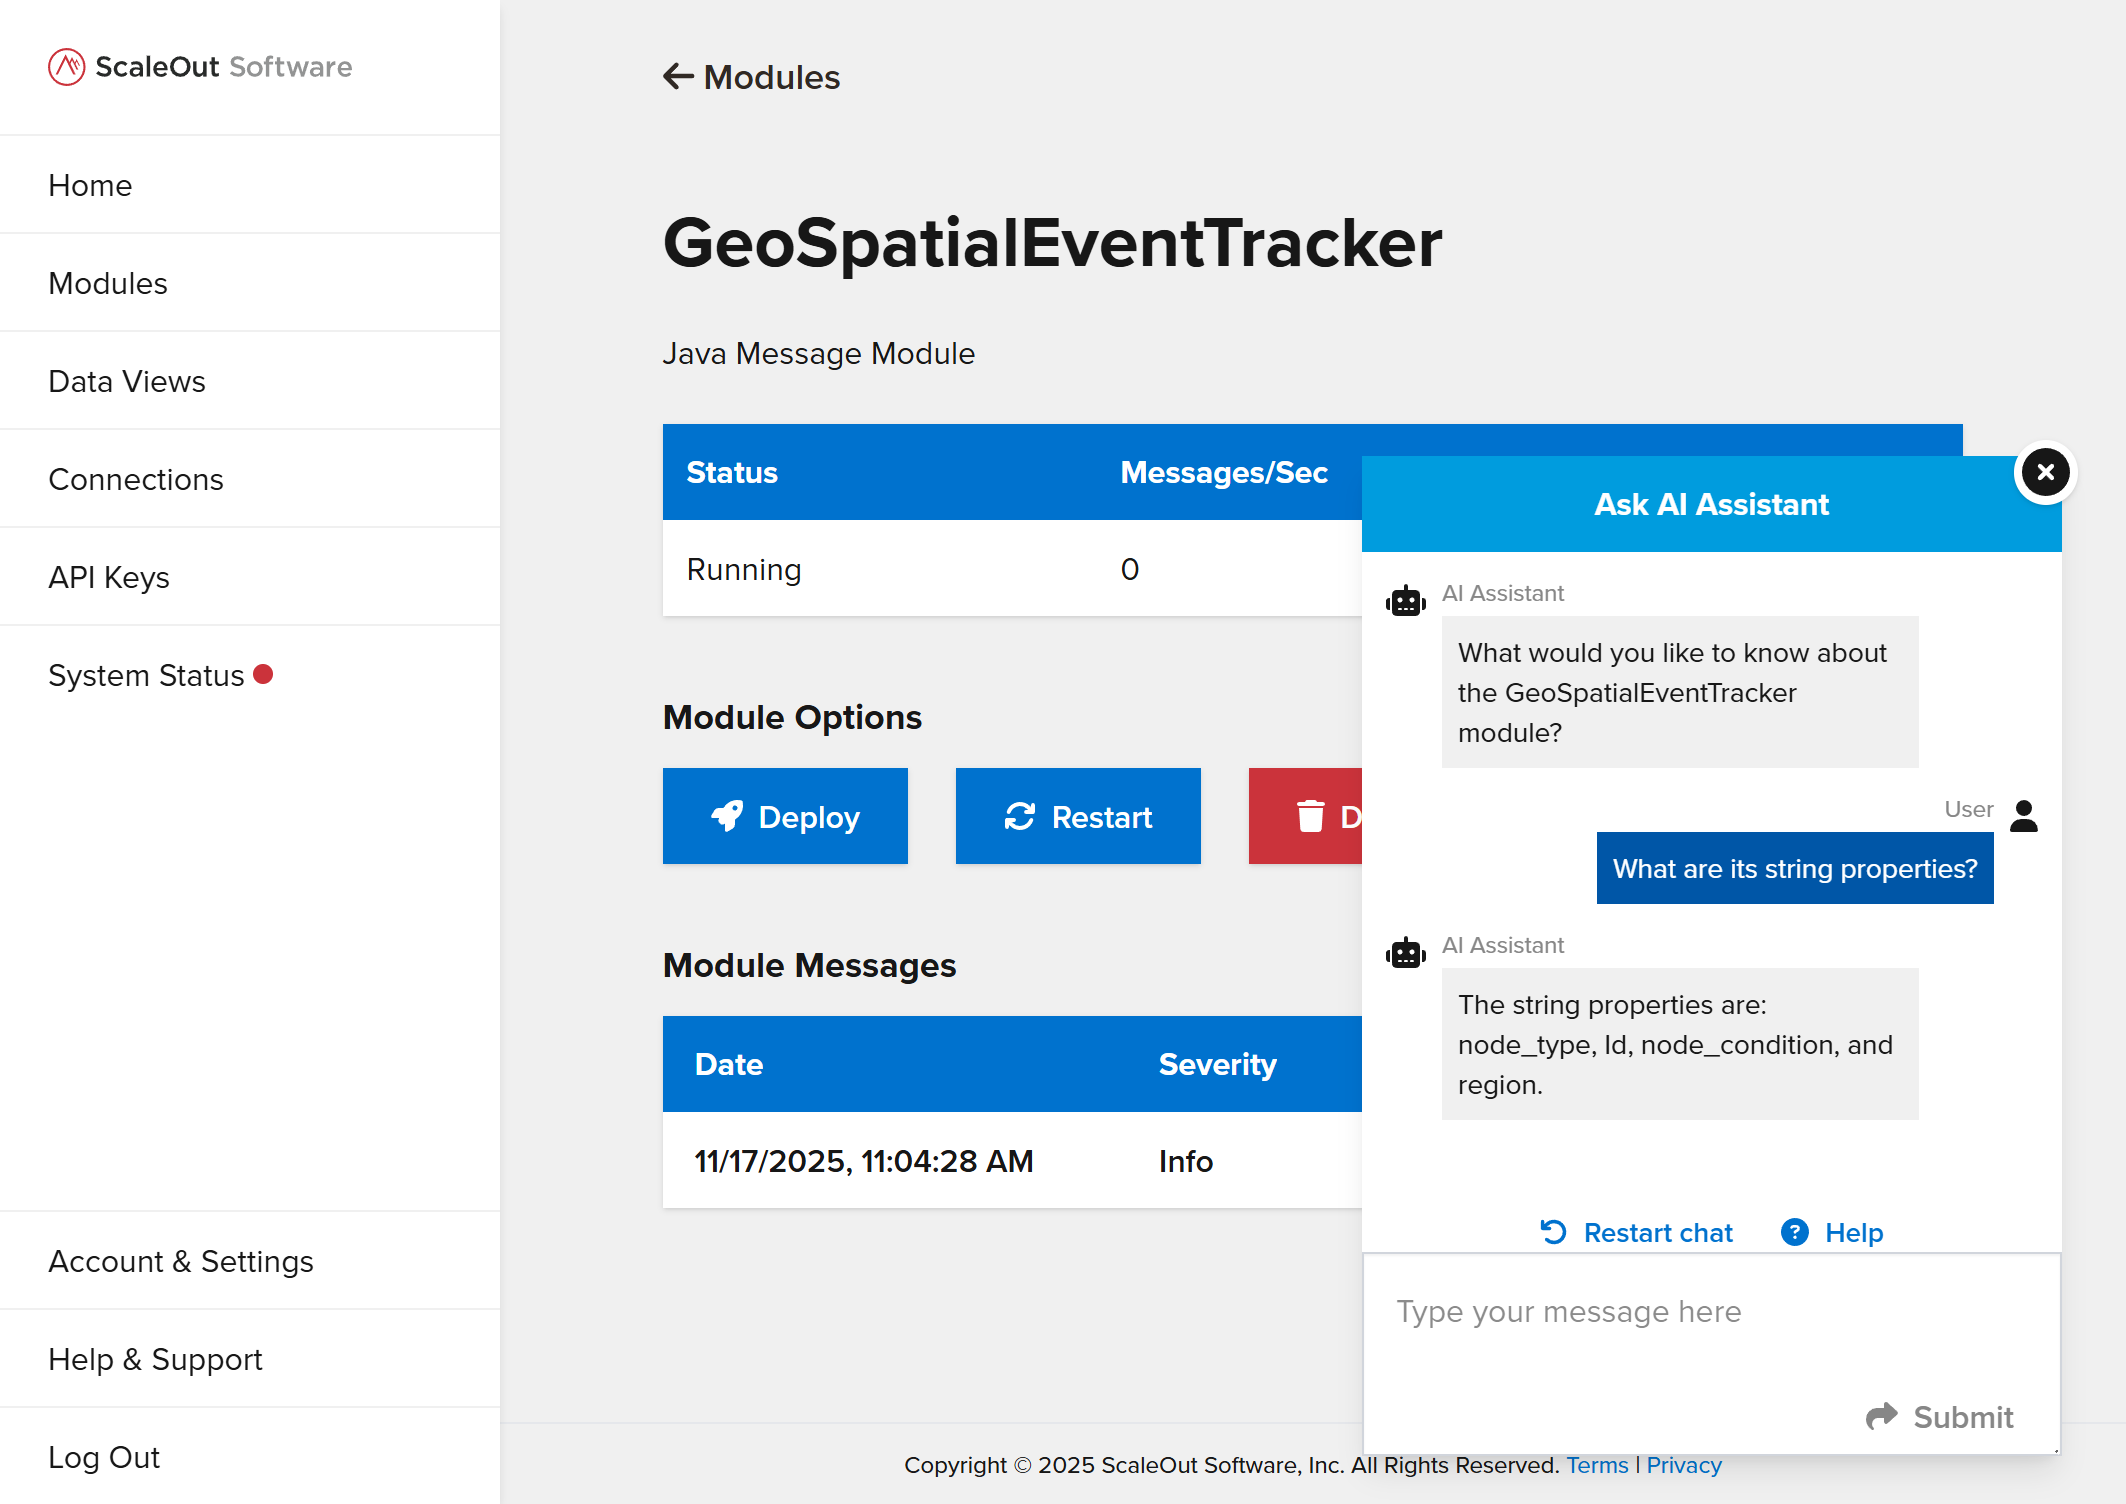
AI chat allows you to ask questions about your API modules and message modules.
Accessing AI Chat
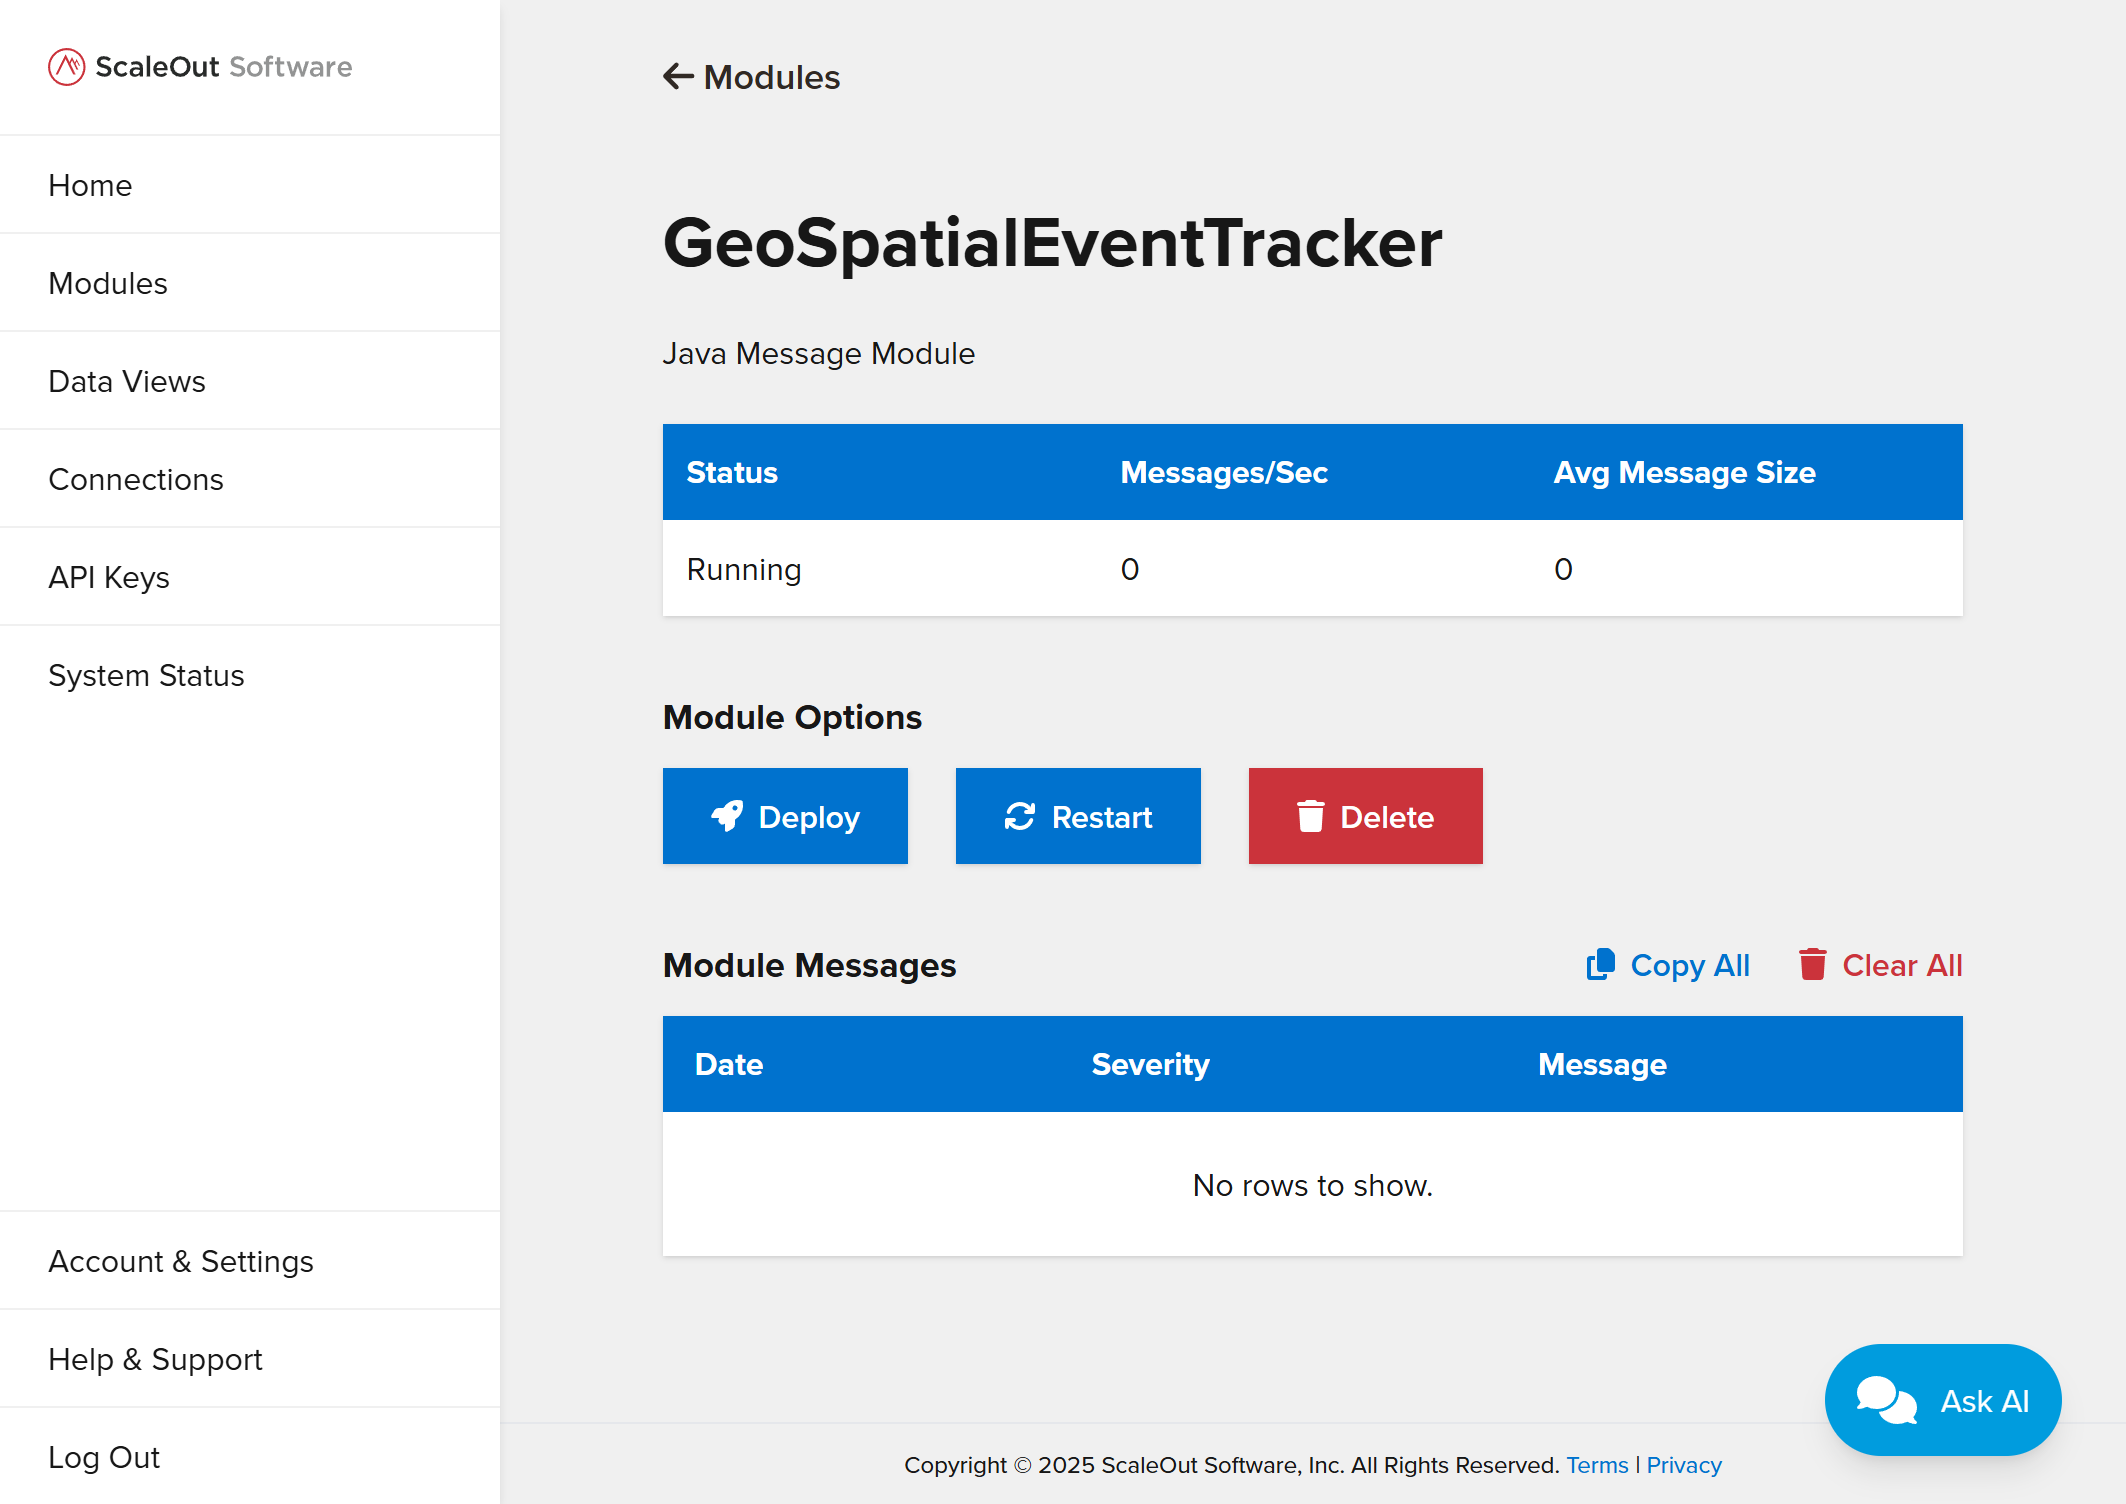
Go to the Modules page and click on a module’s name from the table. Then, click the Ask AI button in the bottom right to open the AI chat window.
Best Practices for AI Chat
The AI Assistant has a conceptual understanding of the ScaleOut Active Caching platform and modules, and it has access to information about your modules, including their properties and type. In some cases, the AI assistant will offer to generate a data view (chart or query) that answers your question.
For best results, phrase your question or request as simply and clearly as possible. Examples of topics you can ask about include:
What properties the module has
The average value of a certain property
Lists of objects filtered by property (e.g. region, flag, value above a certain threshold)
Known Limitations
The AI Assistant is currently unable to answer certain types of requests, including:
Module metadata it does not have access to (e.g., the date the module was created)
Requests to run code snippets
Time-based inquiries (e.g., how the value of a specified property compares to the previous month)
Generating Data Views
Accessing AI Mode
Go to the Data Views page and click Add Data View. Then click the AI Mode button in the top right. If you would like to go back to the classic builder mode, click the Builder Mode button.
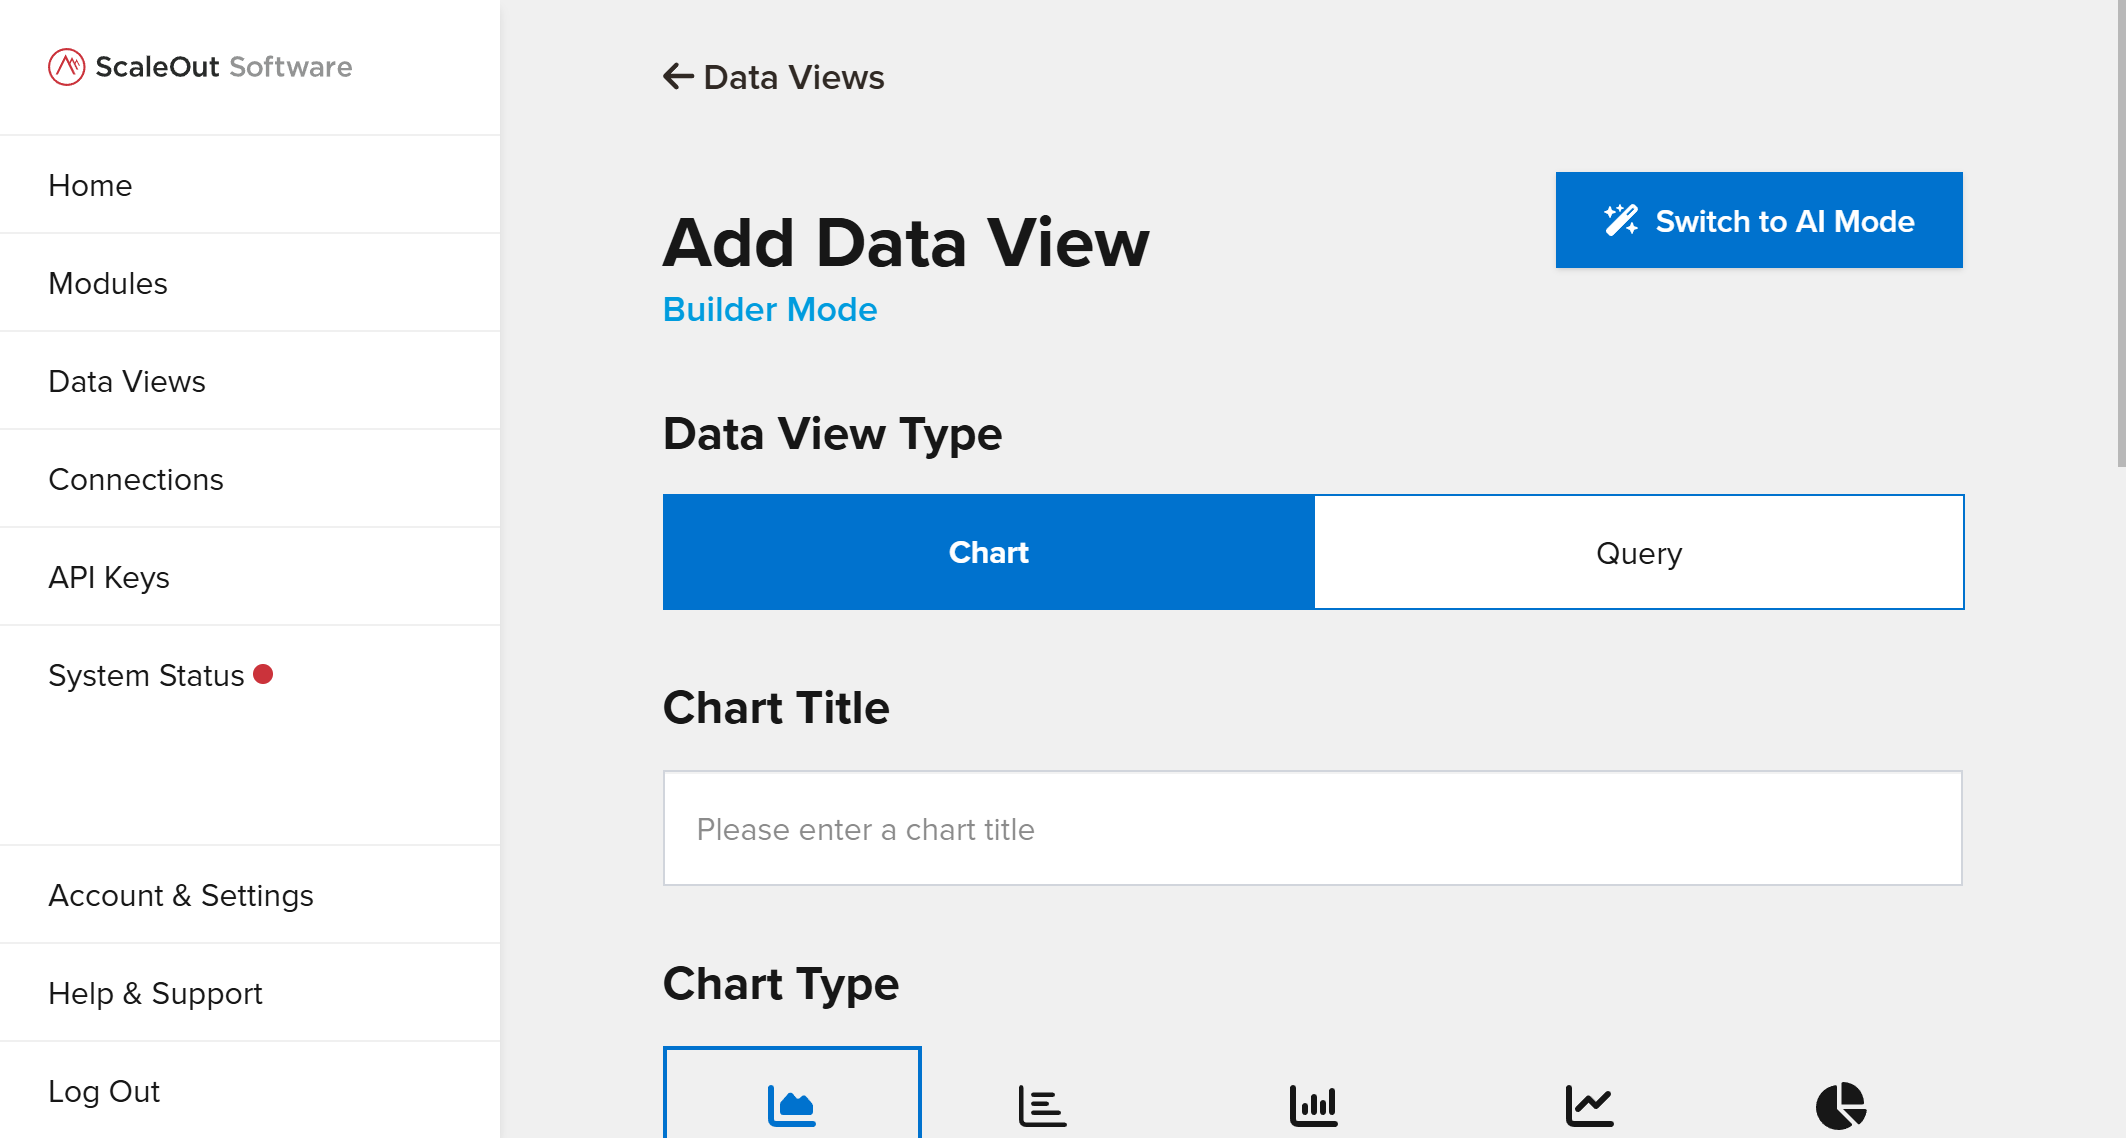
Builder Mode is shown above.
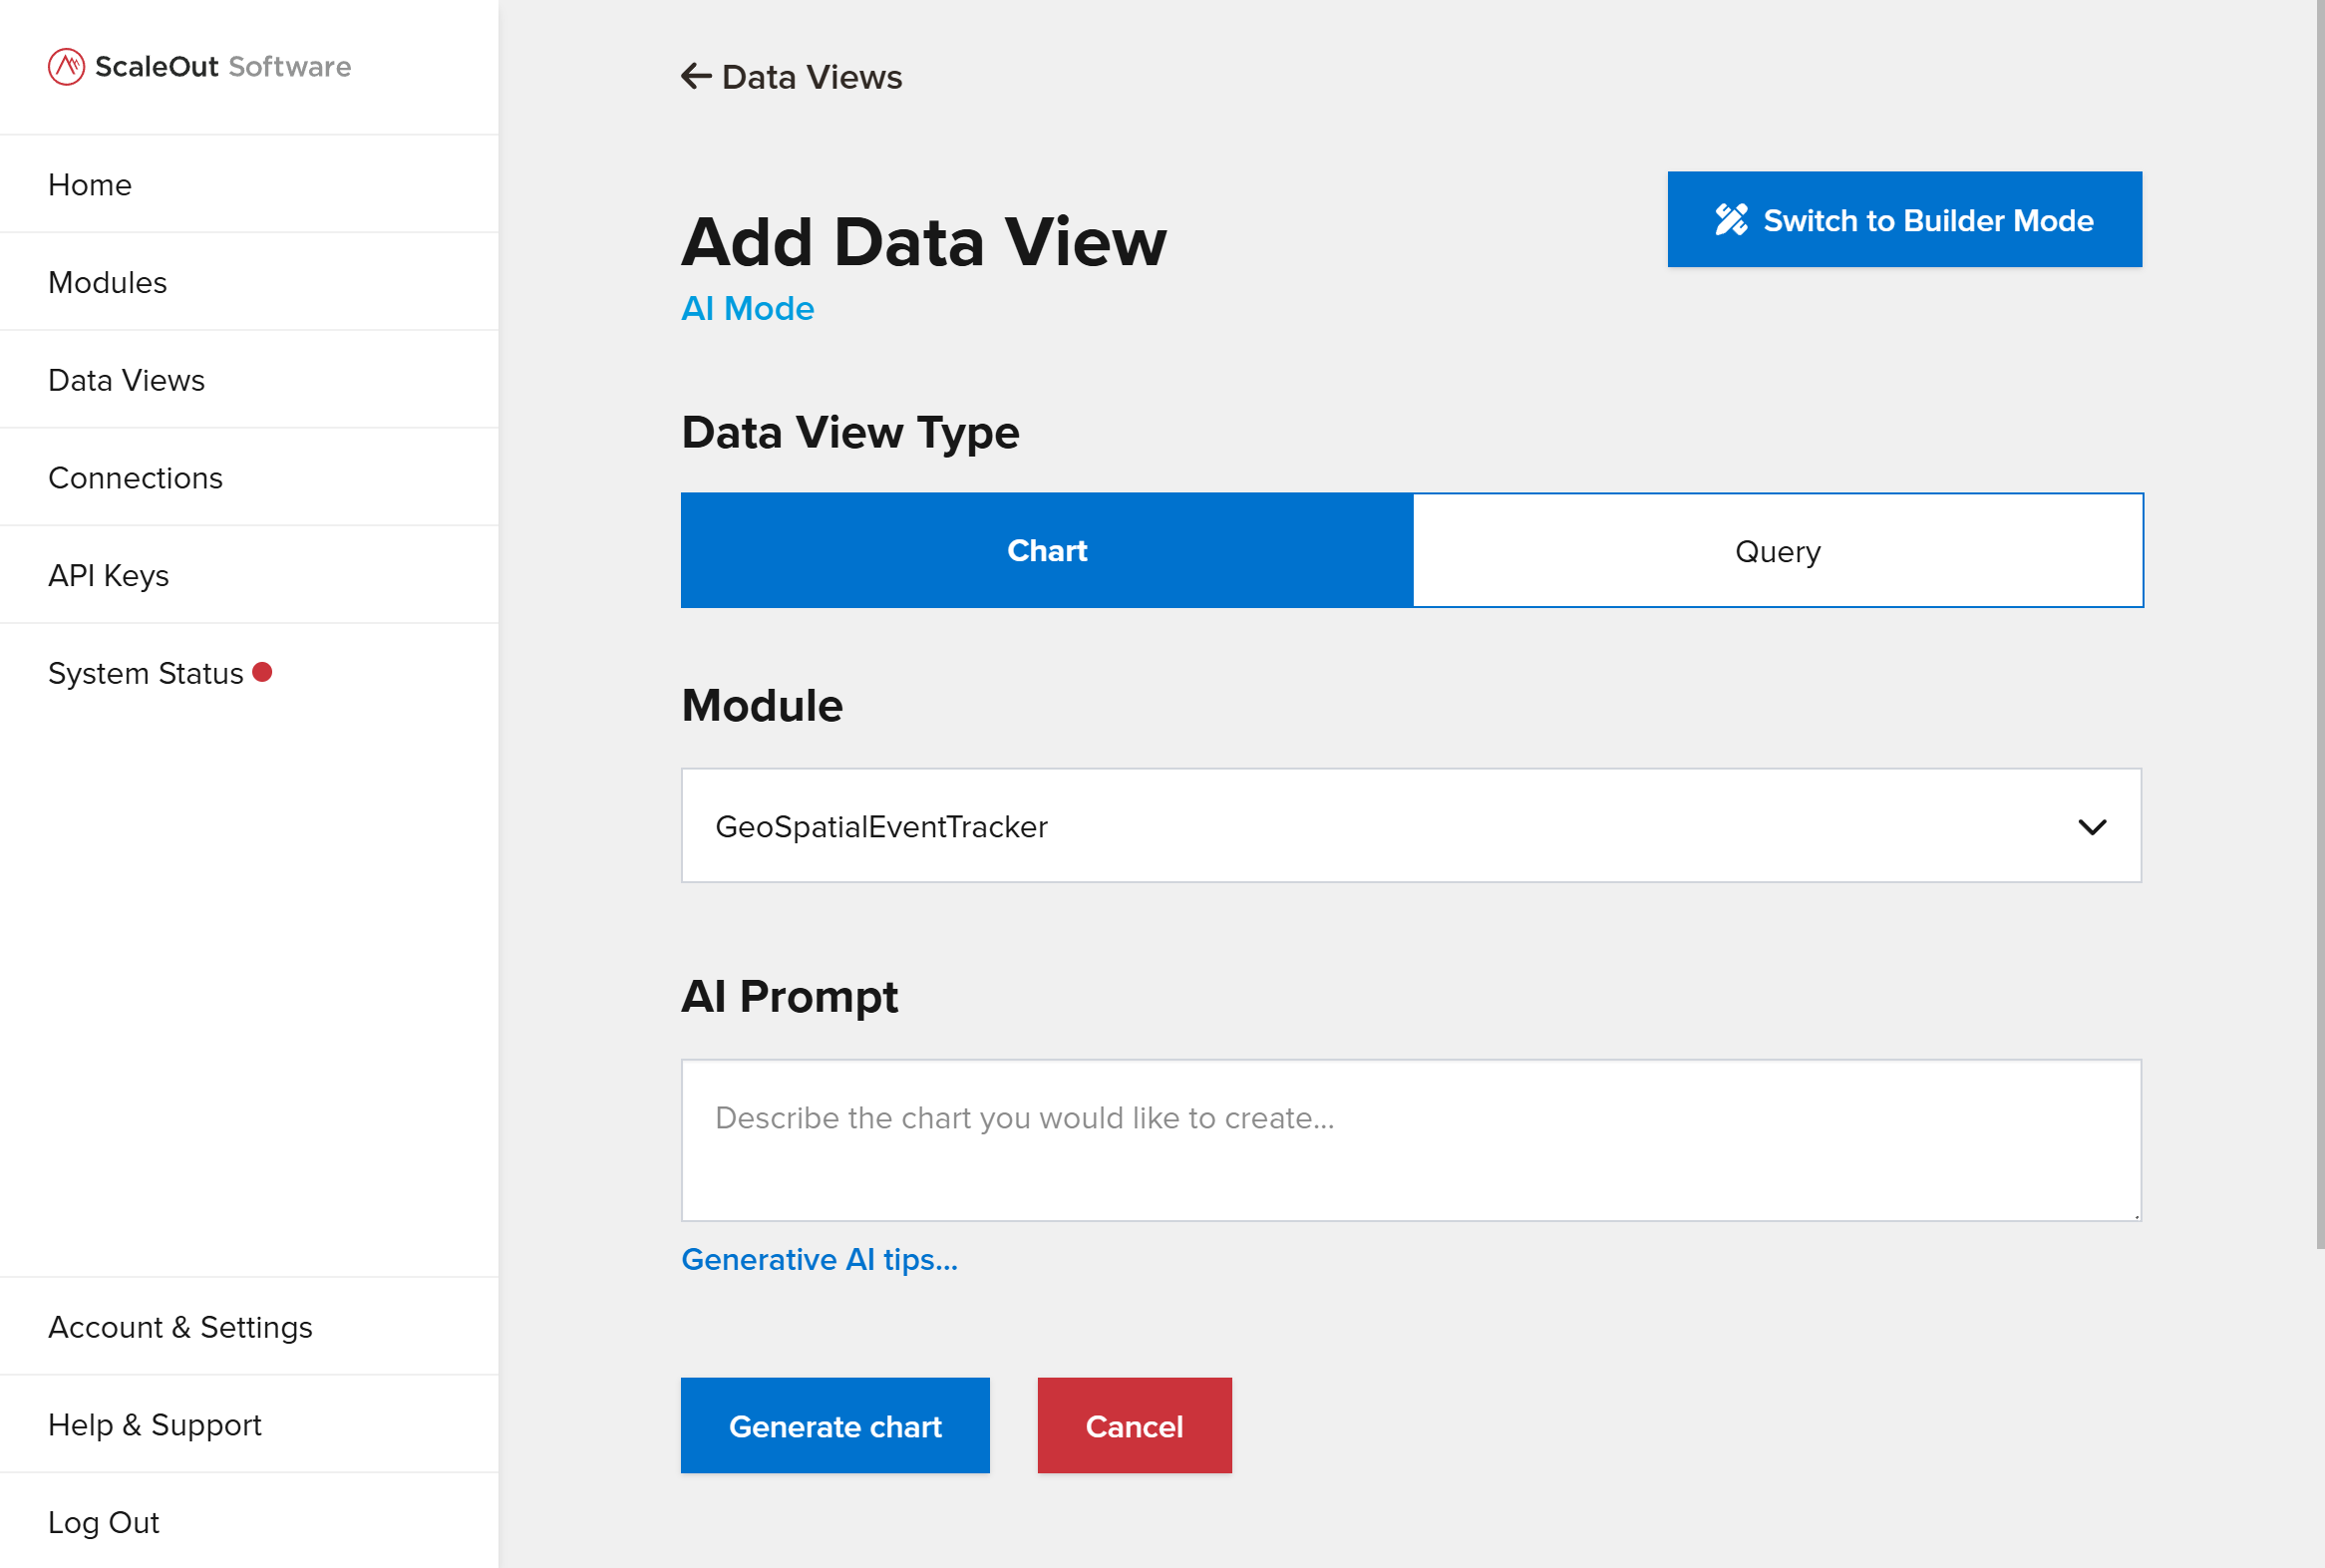
AI Mode is shown above.
Generating a Chart or Query
To generate a chart or query in AI mode, first select the Chart or Query tab for your preferred data view type. Select a module, then enter a short description of your desired chart/query in the AI Prompt field. Click Generate to attempt to generate the data view.
If successful, you will be redirected to the requested data view. If the AI assistant is unable to create the requested data view, see the error message for details. You can then refine your prompt and try again.
Trend and Anomaly Detection
You can enable trend and anomaly detection for any chart or query you create or generate. To enable, check the AI-Powered Trend and Anomaly Detection checkbox on the form.
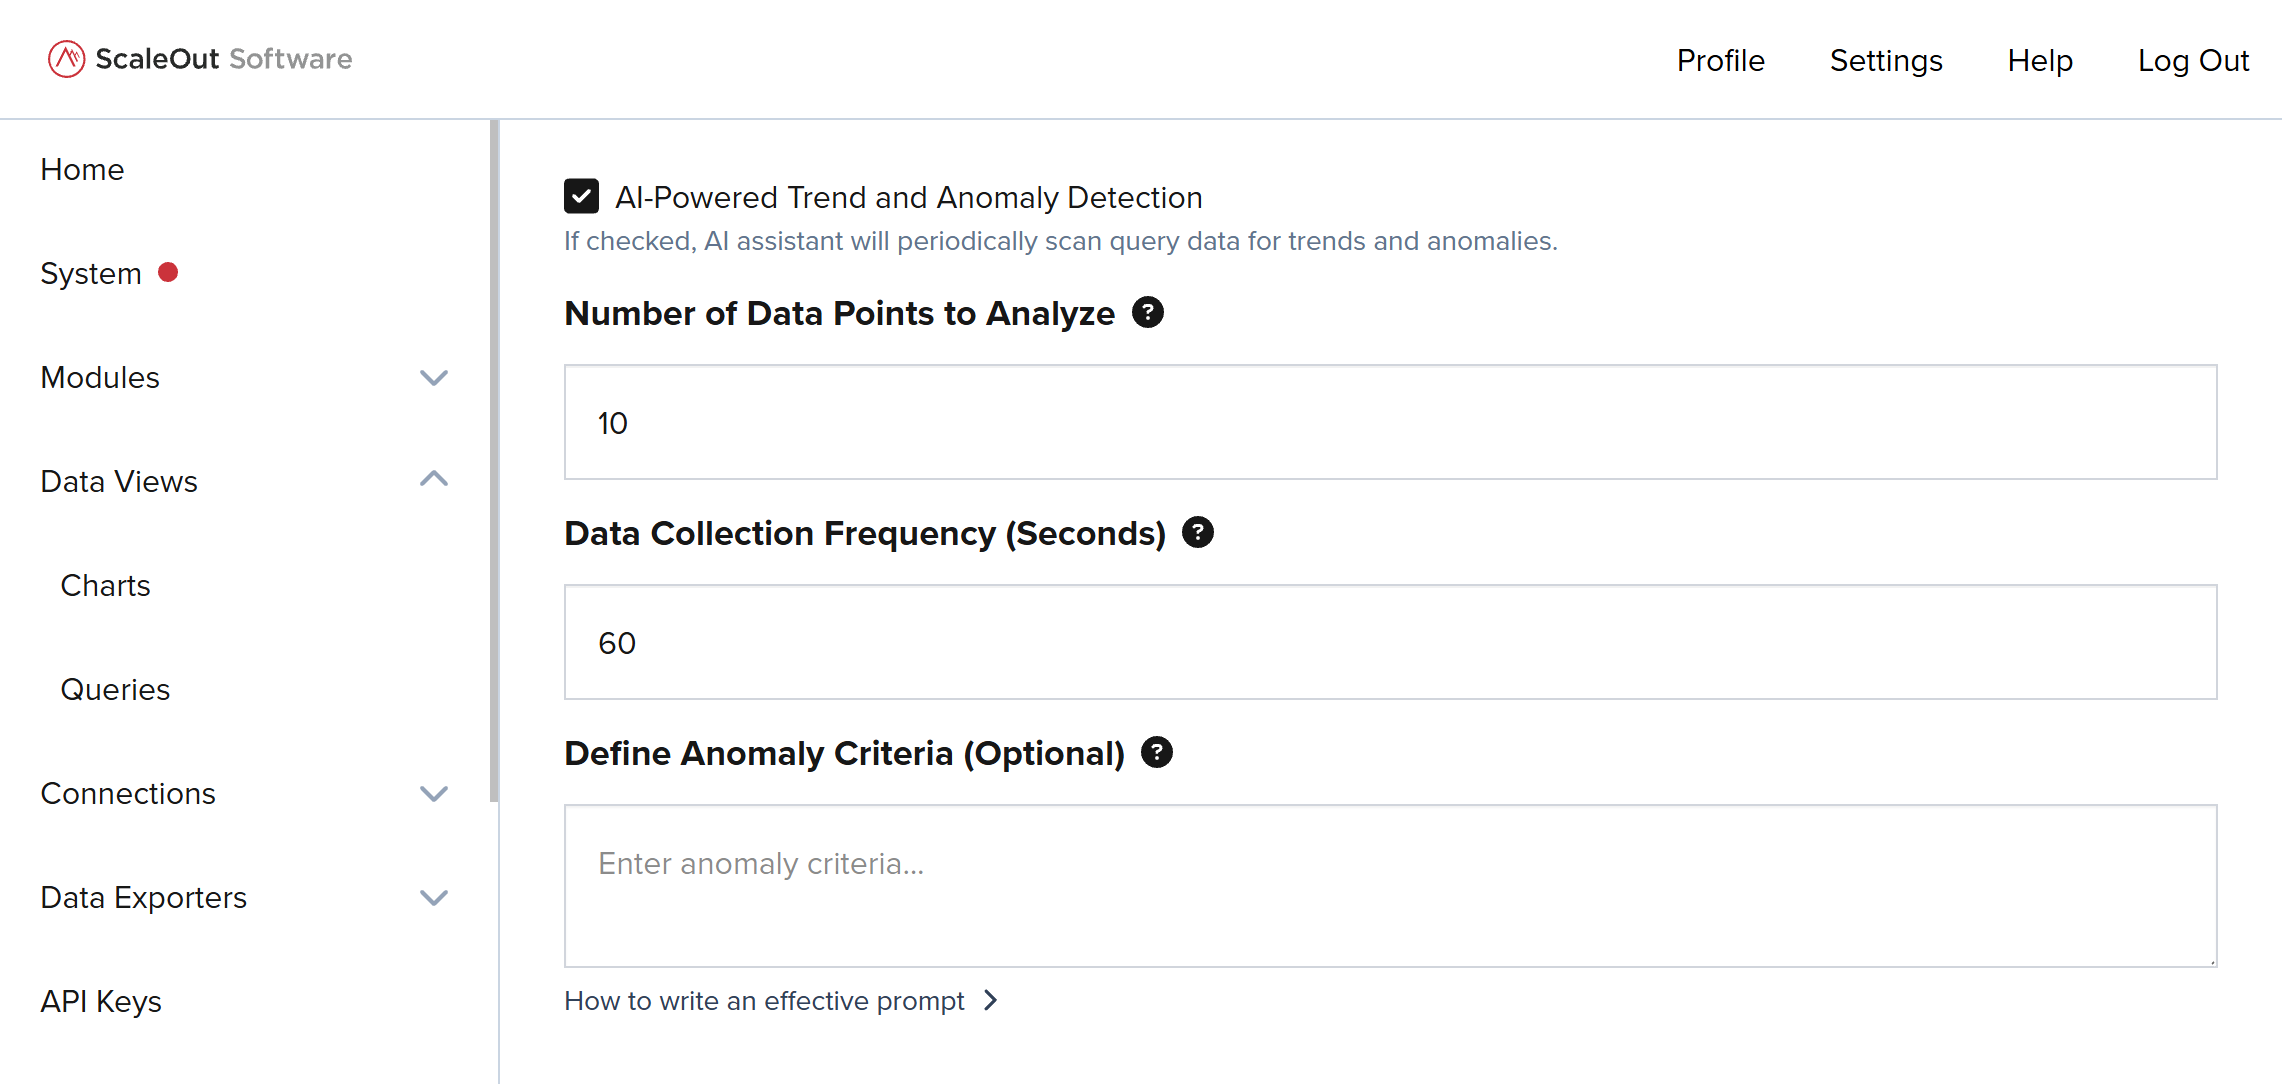
Then, enter the parameters for anomaly detection:
Properties to monitor (queries only): the numerical properties to check for trends and anomalies.
Number of data points to analyze: how many historical data points to check for anomalies.
Data collection frequency: how often to capture new data points.
Anomaly criteria (optional): Your own definition of what an anomaly looks like in your data.
Note
The anomaly detection interval (how often the system scans for trends and anomalies) can be configured under Settings > Connected Services > Generative AI
AI Notifications
A feed of all AI-generated notifications can be found on the AI Insights page. This page lists trends and anomalies detected by the AI Assistant, as well as any generated queries and charts.
You can sort notifications by recency, type, or module; and filter by notification type or by module. To refresh the feed with the latest content, click the Refresh Feed button. To clear all notifications, click the Clear All button.
Best Practices for Prompting
For best results, describe your desired data view as simply and clearly as possible. Specify any constraints in your prompt with objective or quantitative terms rather than subjective ones (“large”, “high”, “unusual” etc.). Spelling, grammar, and politeness generally do not affect results. See below for example prompts.
Charts
Chart prompts should specify how you would like the chart to aggregate results (average, min, max, count, or sum), the property to aggregate, and how the data should be grouped. If you would like a specific type of chart (area, column, etc.) you can mention that as well.
Example prompts that will work well:
“Average temperature by region”
“Show a line chart of the max latency by region for SW and NE only”
“Display a count of objects over 5MB where isActive is true”
Example prompts that won’t work as well:
“Show count of very large objects in important regions” - Subjective language
“Create a scatter plot of objects by temperature and latency” - Unsupported chart type
“Show a moving average of object size over the last month” - Unsupported time-based constraint
Queries
Query prompts should describe a query the system can create. Parameters you can specify include the properties to select, number of objects to select (up to 1000), constraints (where clauses), and display preferences (table vs map, and whether you want the query to refresh continuously).
Note
Order By and Group By statements are not currently supported. For ordering, you can sort the table data by column once the query is created. For Group By, a chart may be more suitable.
Example prompts that will work well:
“Find objects in the East region with isActive set to false”
“Show a map of all objects where temperature is between 25 and 75”
“Display Id, region, and temperature for objects with speed less than 50”
Example prompts that won’t work as well:
“Show me all objects ordered by temperature descending” - Unsupported Order By constraint
“Make a table listing the maximum speed by region” - Requires a Group By constraint; better achieved with a chart
“Display the 10,000 most important objects” - Limit is too large (>1000) and prompt uses subjective language