Data Views
This section explains how to use data views in the UI to visualize and analyze module data.
Charts
The UI allows you to visualize data with graphical charts including area, line, bar/column, and pie charts. These charts update every few seconds to display the latest module data.
Creating a Chart
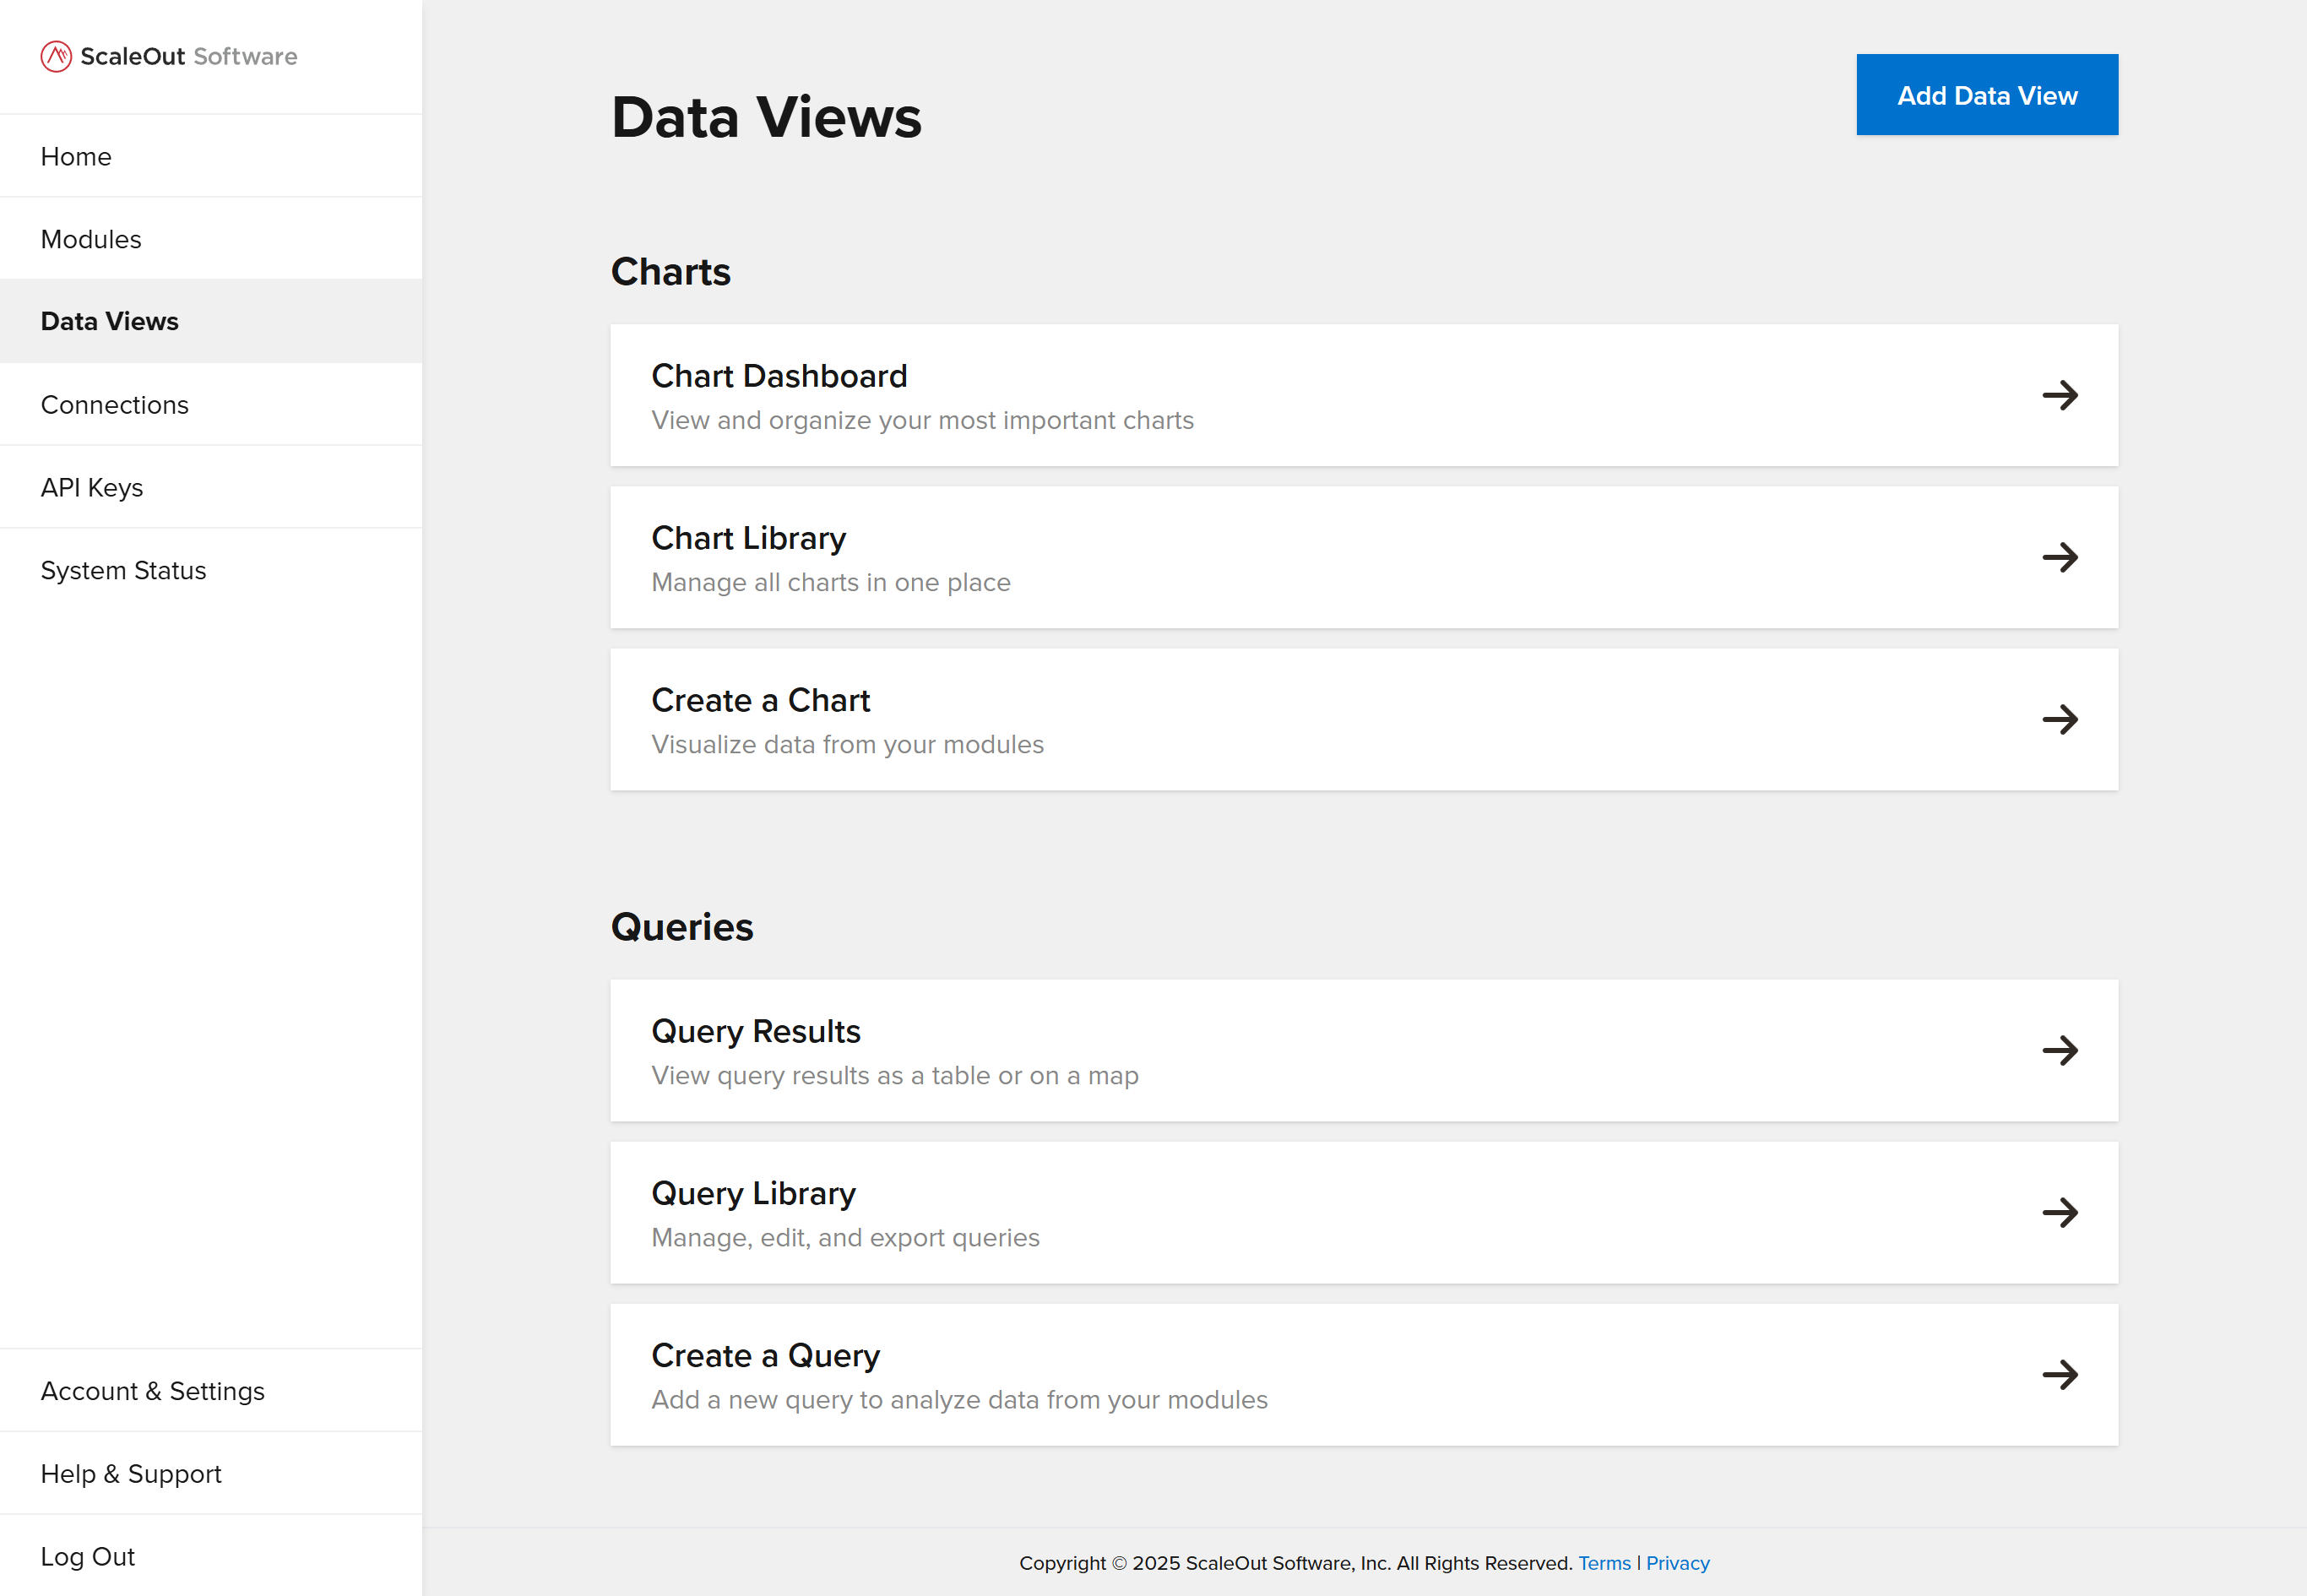
To create a new chart, first navigate to the Data Views page in the UI. Then click either the Add Data View button in the top right, or the Create a Chart link under the options for charts.
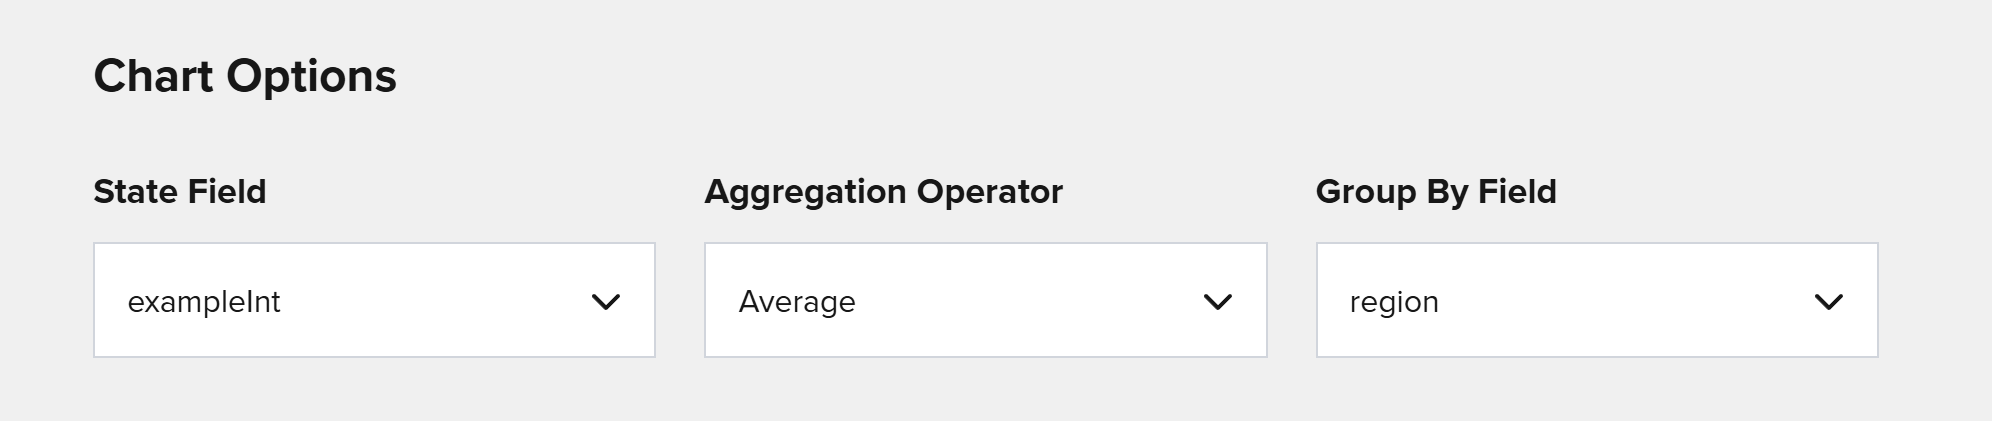
Complete the form by specifying a chart title, type, and module. Under Chart Options, select a state field, aggregation operator, and group-by field, as in the example below:
Note
The lists of available state fields and group-by fields depend on your model’s properties and allow you to create many different types of charts. For example, to create a chart of average temperature by region, you could select Temperature for the state field, Average for the aggregation operator, and Region for the group by field.
Where Clauses
You can optionally add where clauses to filter the data displayed in your charts. For example, you might only want to display data from certain locations, with certain flags, or with parameters above or below certain values.
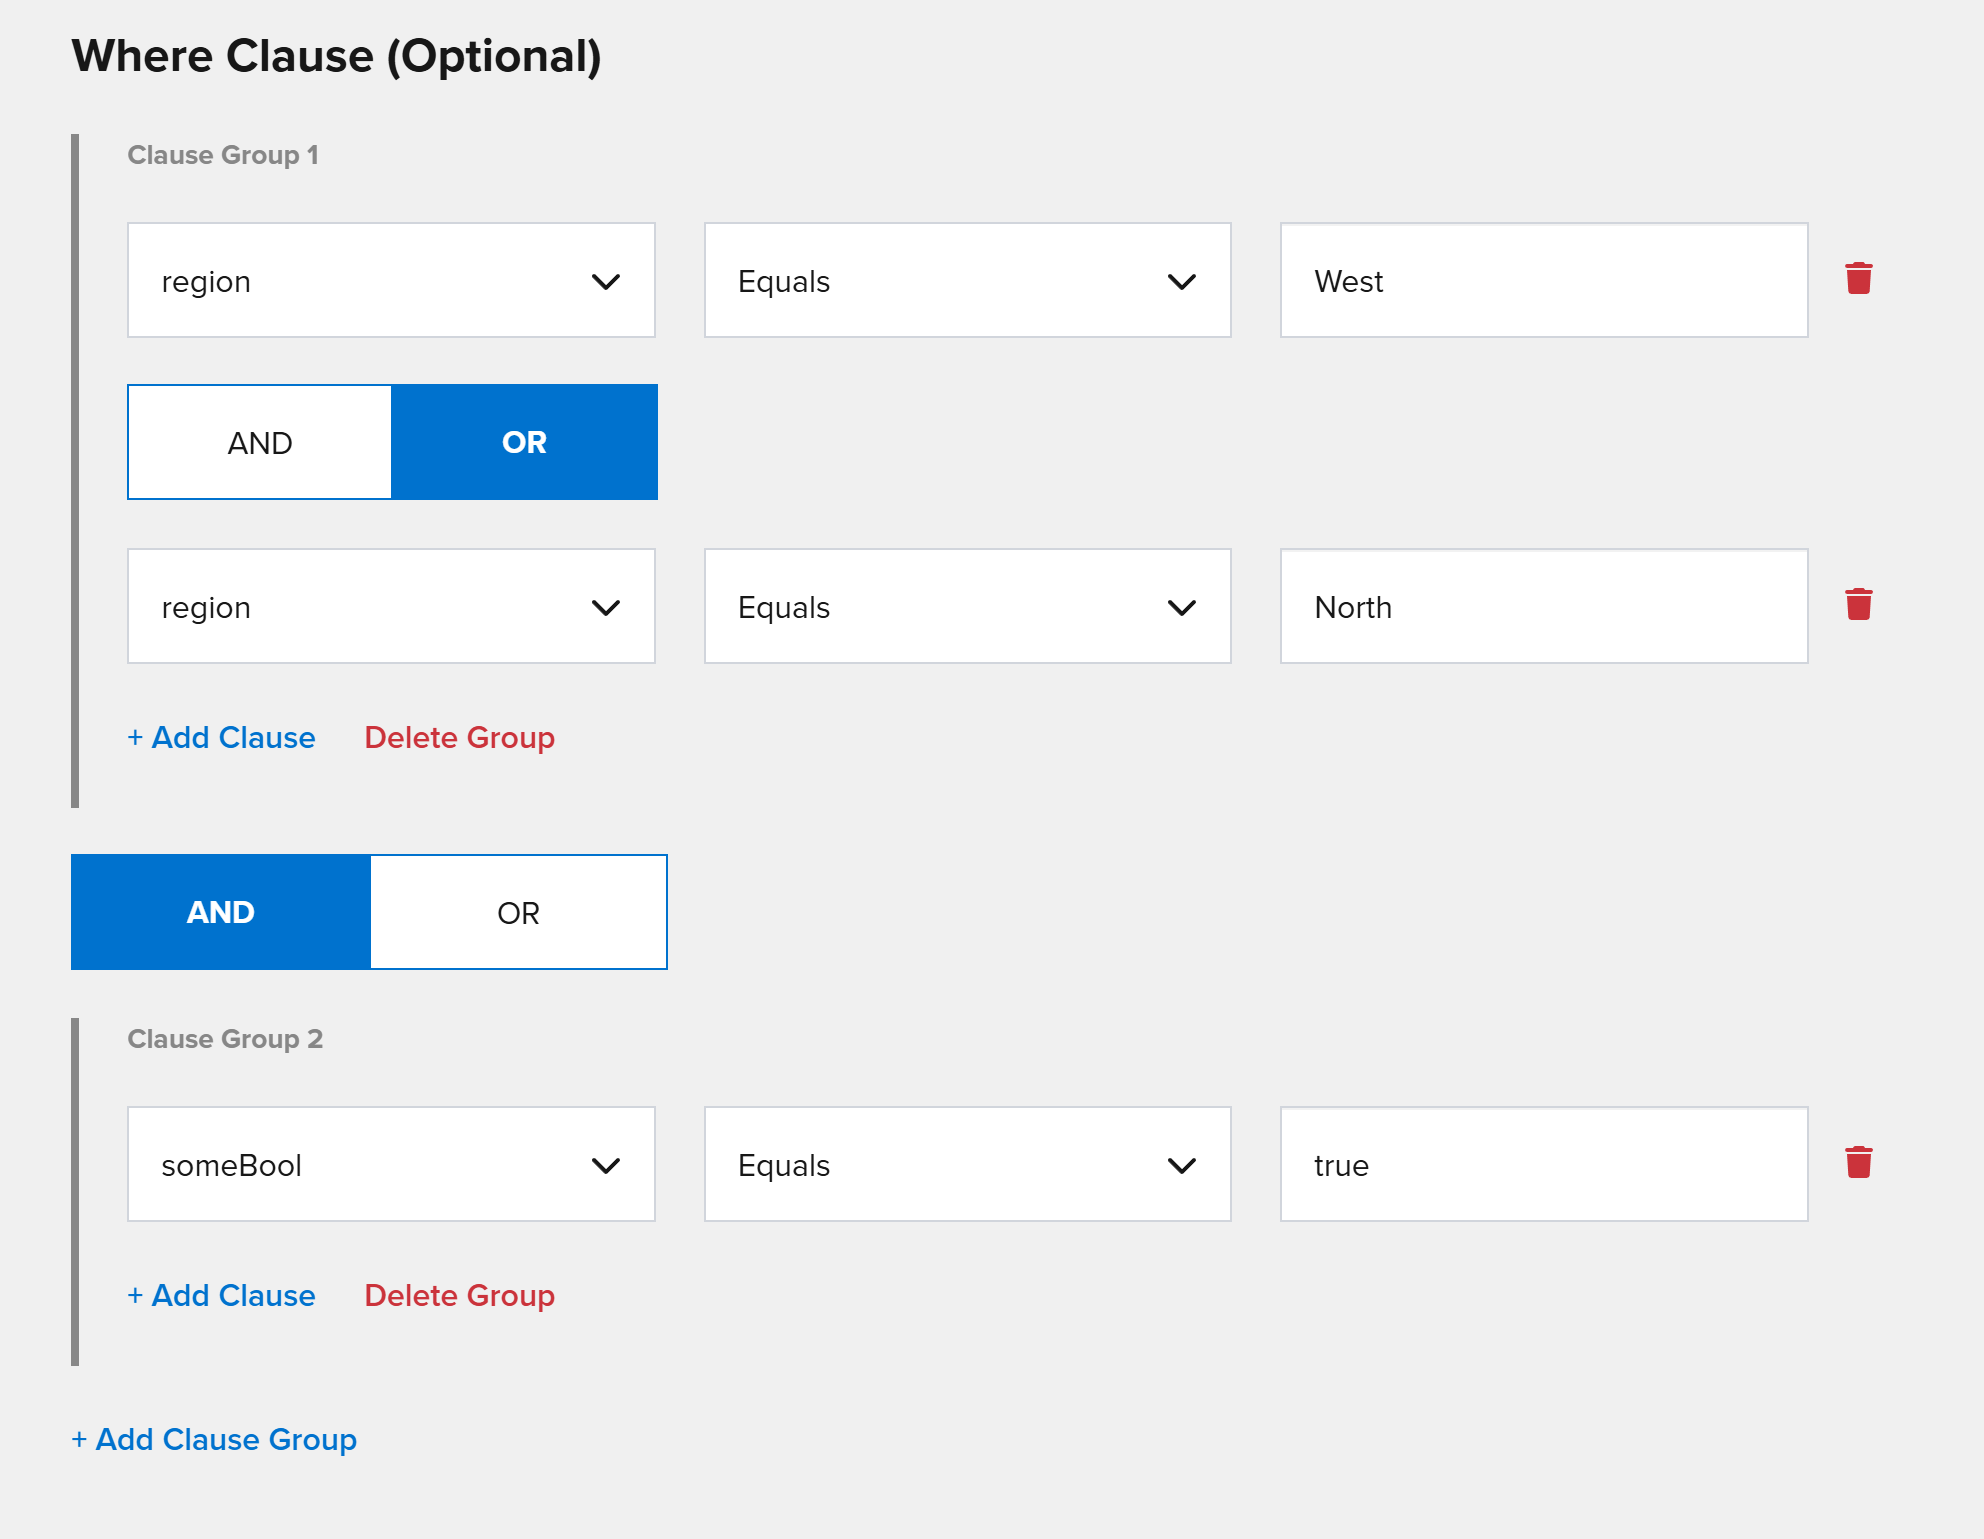
To add a where clause, first click the Add Clause Group button to create a new clause group. This will create a group with one where clause. To construct a where clause, select a property and comparison operator, and specify a value.
To add a new clause within a group, click Add Clause. To delete a clause, click the trash can icon on the right. To delete an entire clause group, click Delete Group.
Note
Understanding Clause Groups
Clause groups function like parentheses. For example, say you have 3 where clauses, A, B, and C. You can apply different logic with different groupings:
(A AND B) OR (C)
(A) AND (B OR C)
Also note that the following are equivalent:
(A AND B OR C)
(A) AND (B) OR (C)
To finish creating the chart, click Add Chart. To cancel and return to the previous page, click Cancel.
Chart Library
Once you create a chart, it will be available in your Chart Library. To access the chart library, go to the Data Views page and click the Chart Library link. The table displays a list of all charts that are currently in the system.
Click the 3 dots icon in the Options column to display options for a given chart. You can view an individual chart, edit the chart, export it as JSON, or delete it from the system. To delete multiple charts at once, select them in the table and click the Delete Charts button above the table.
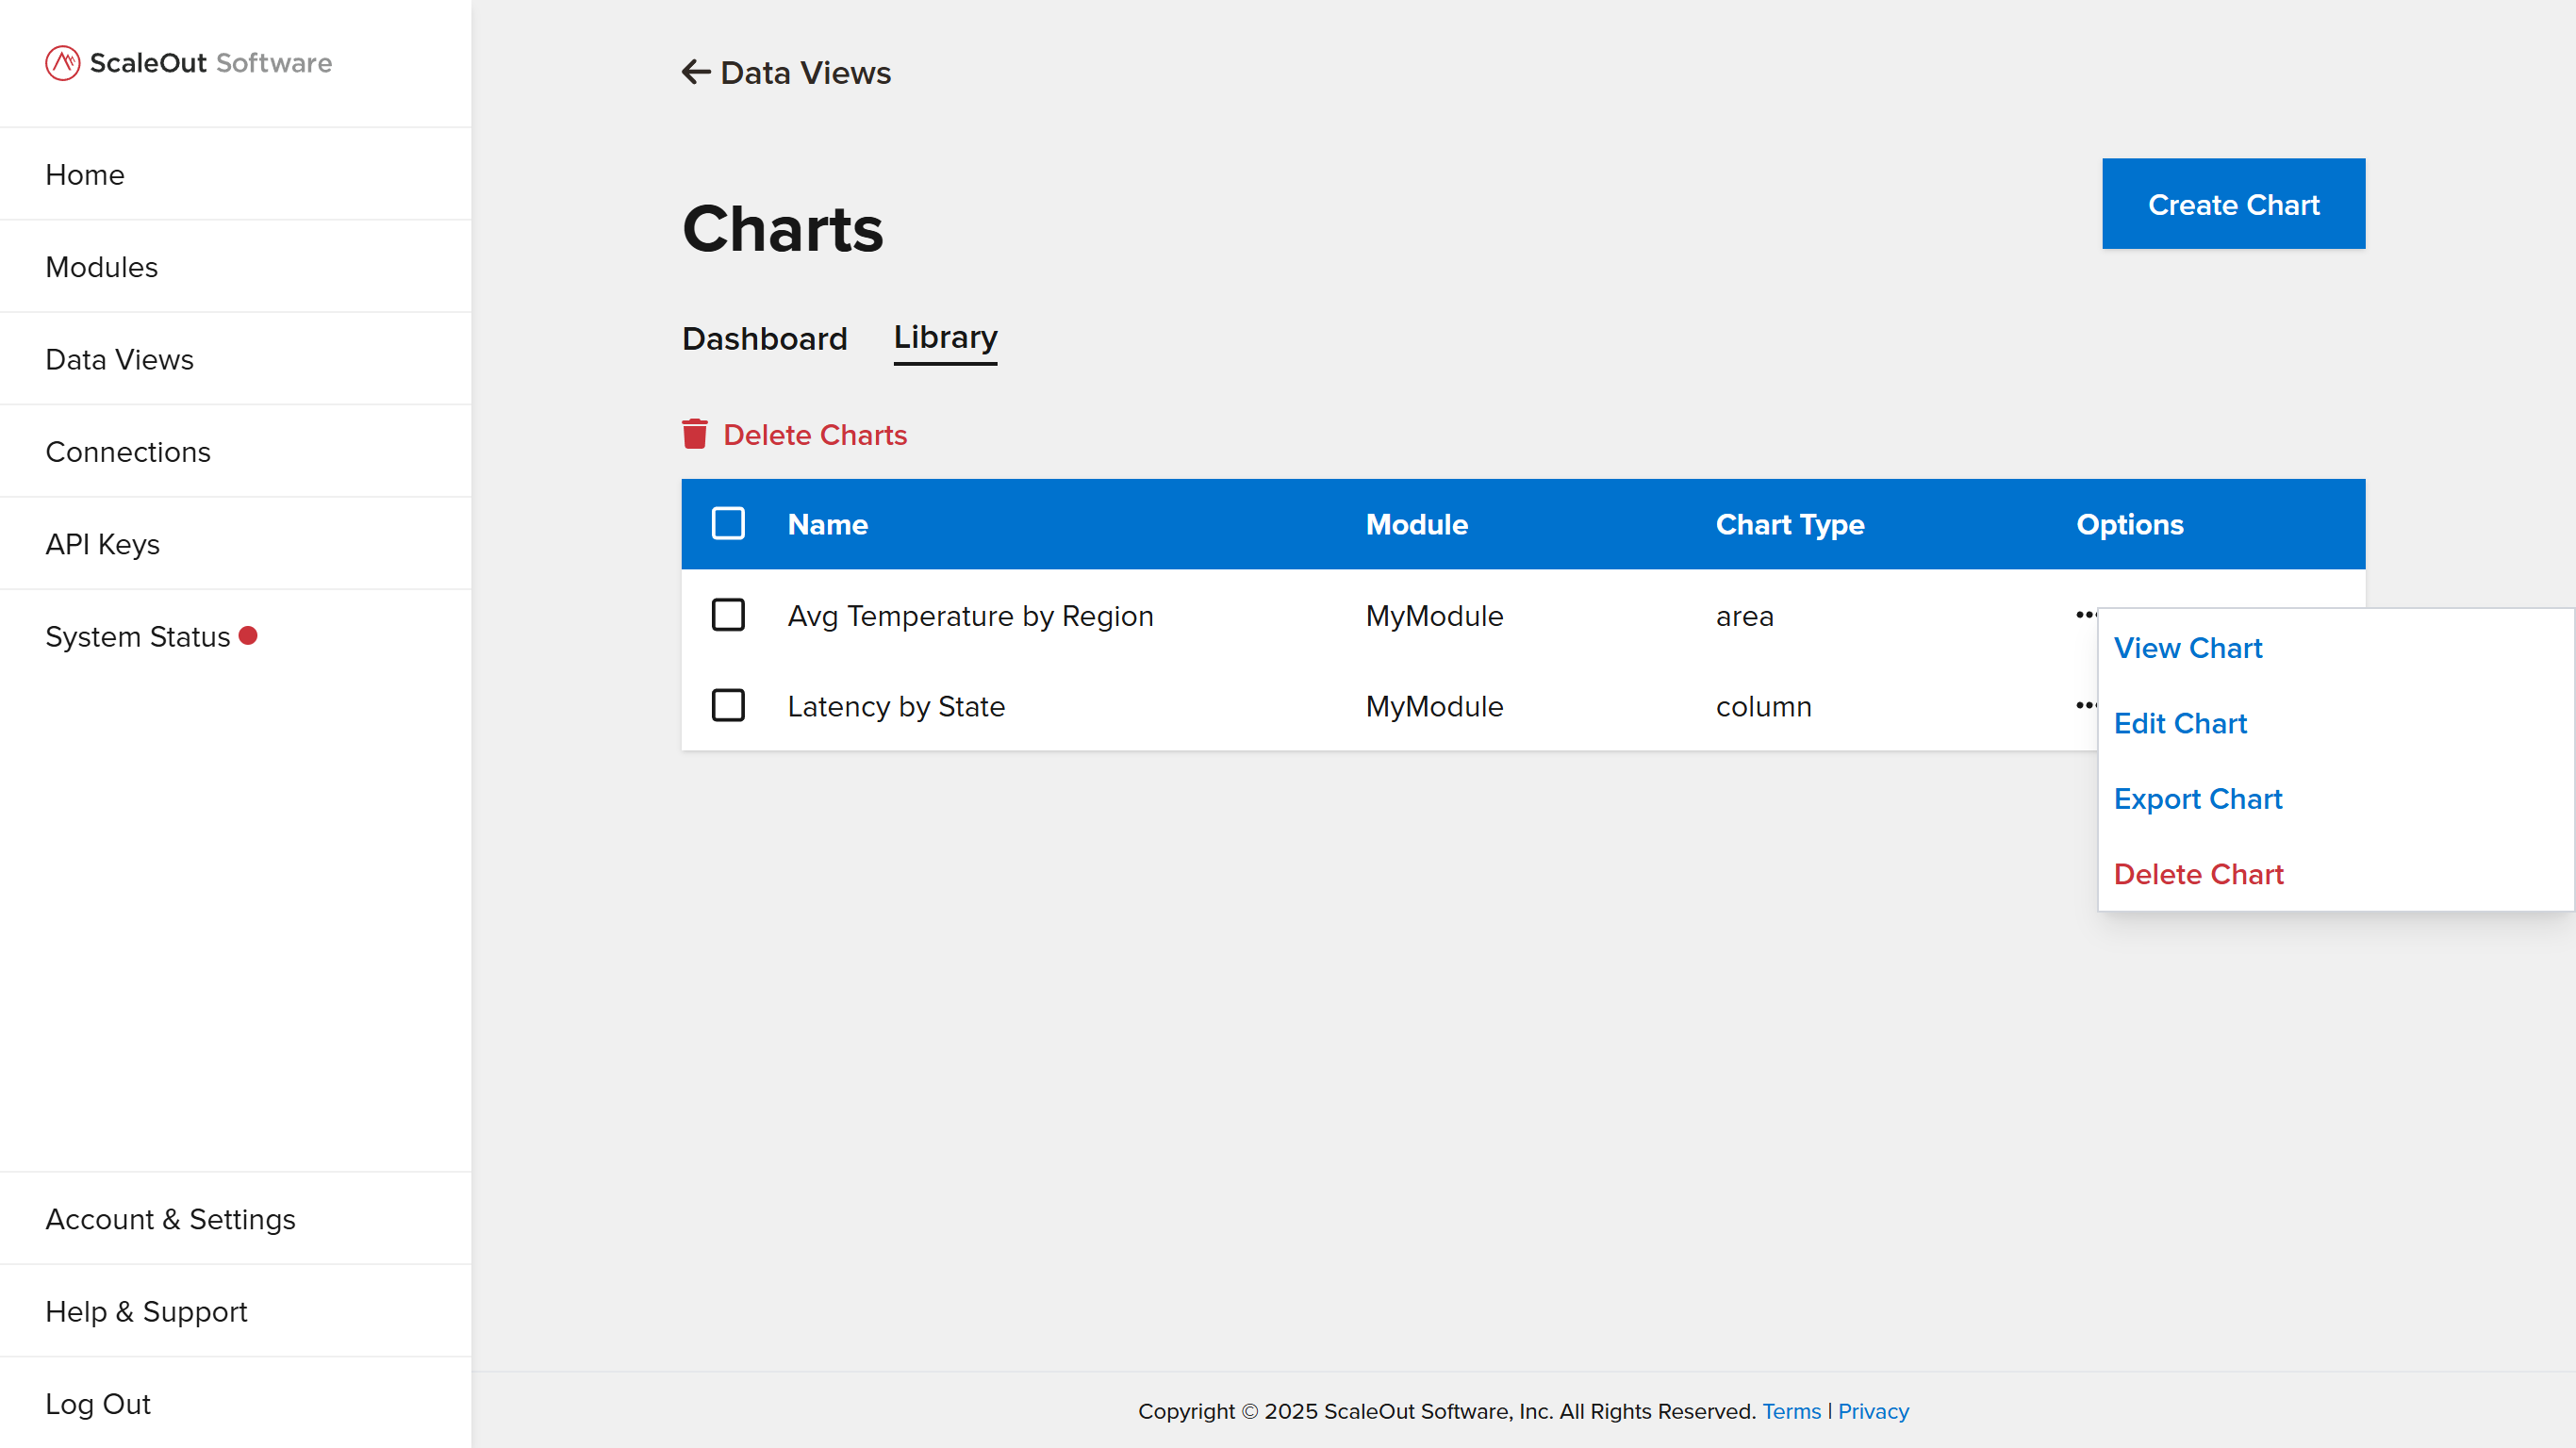
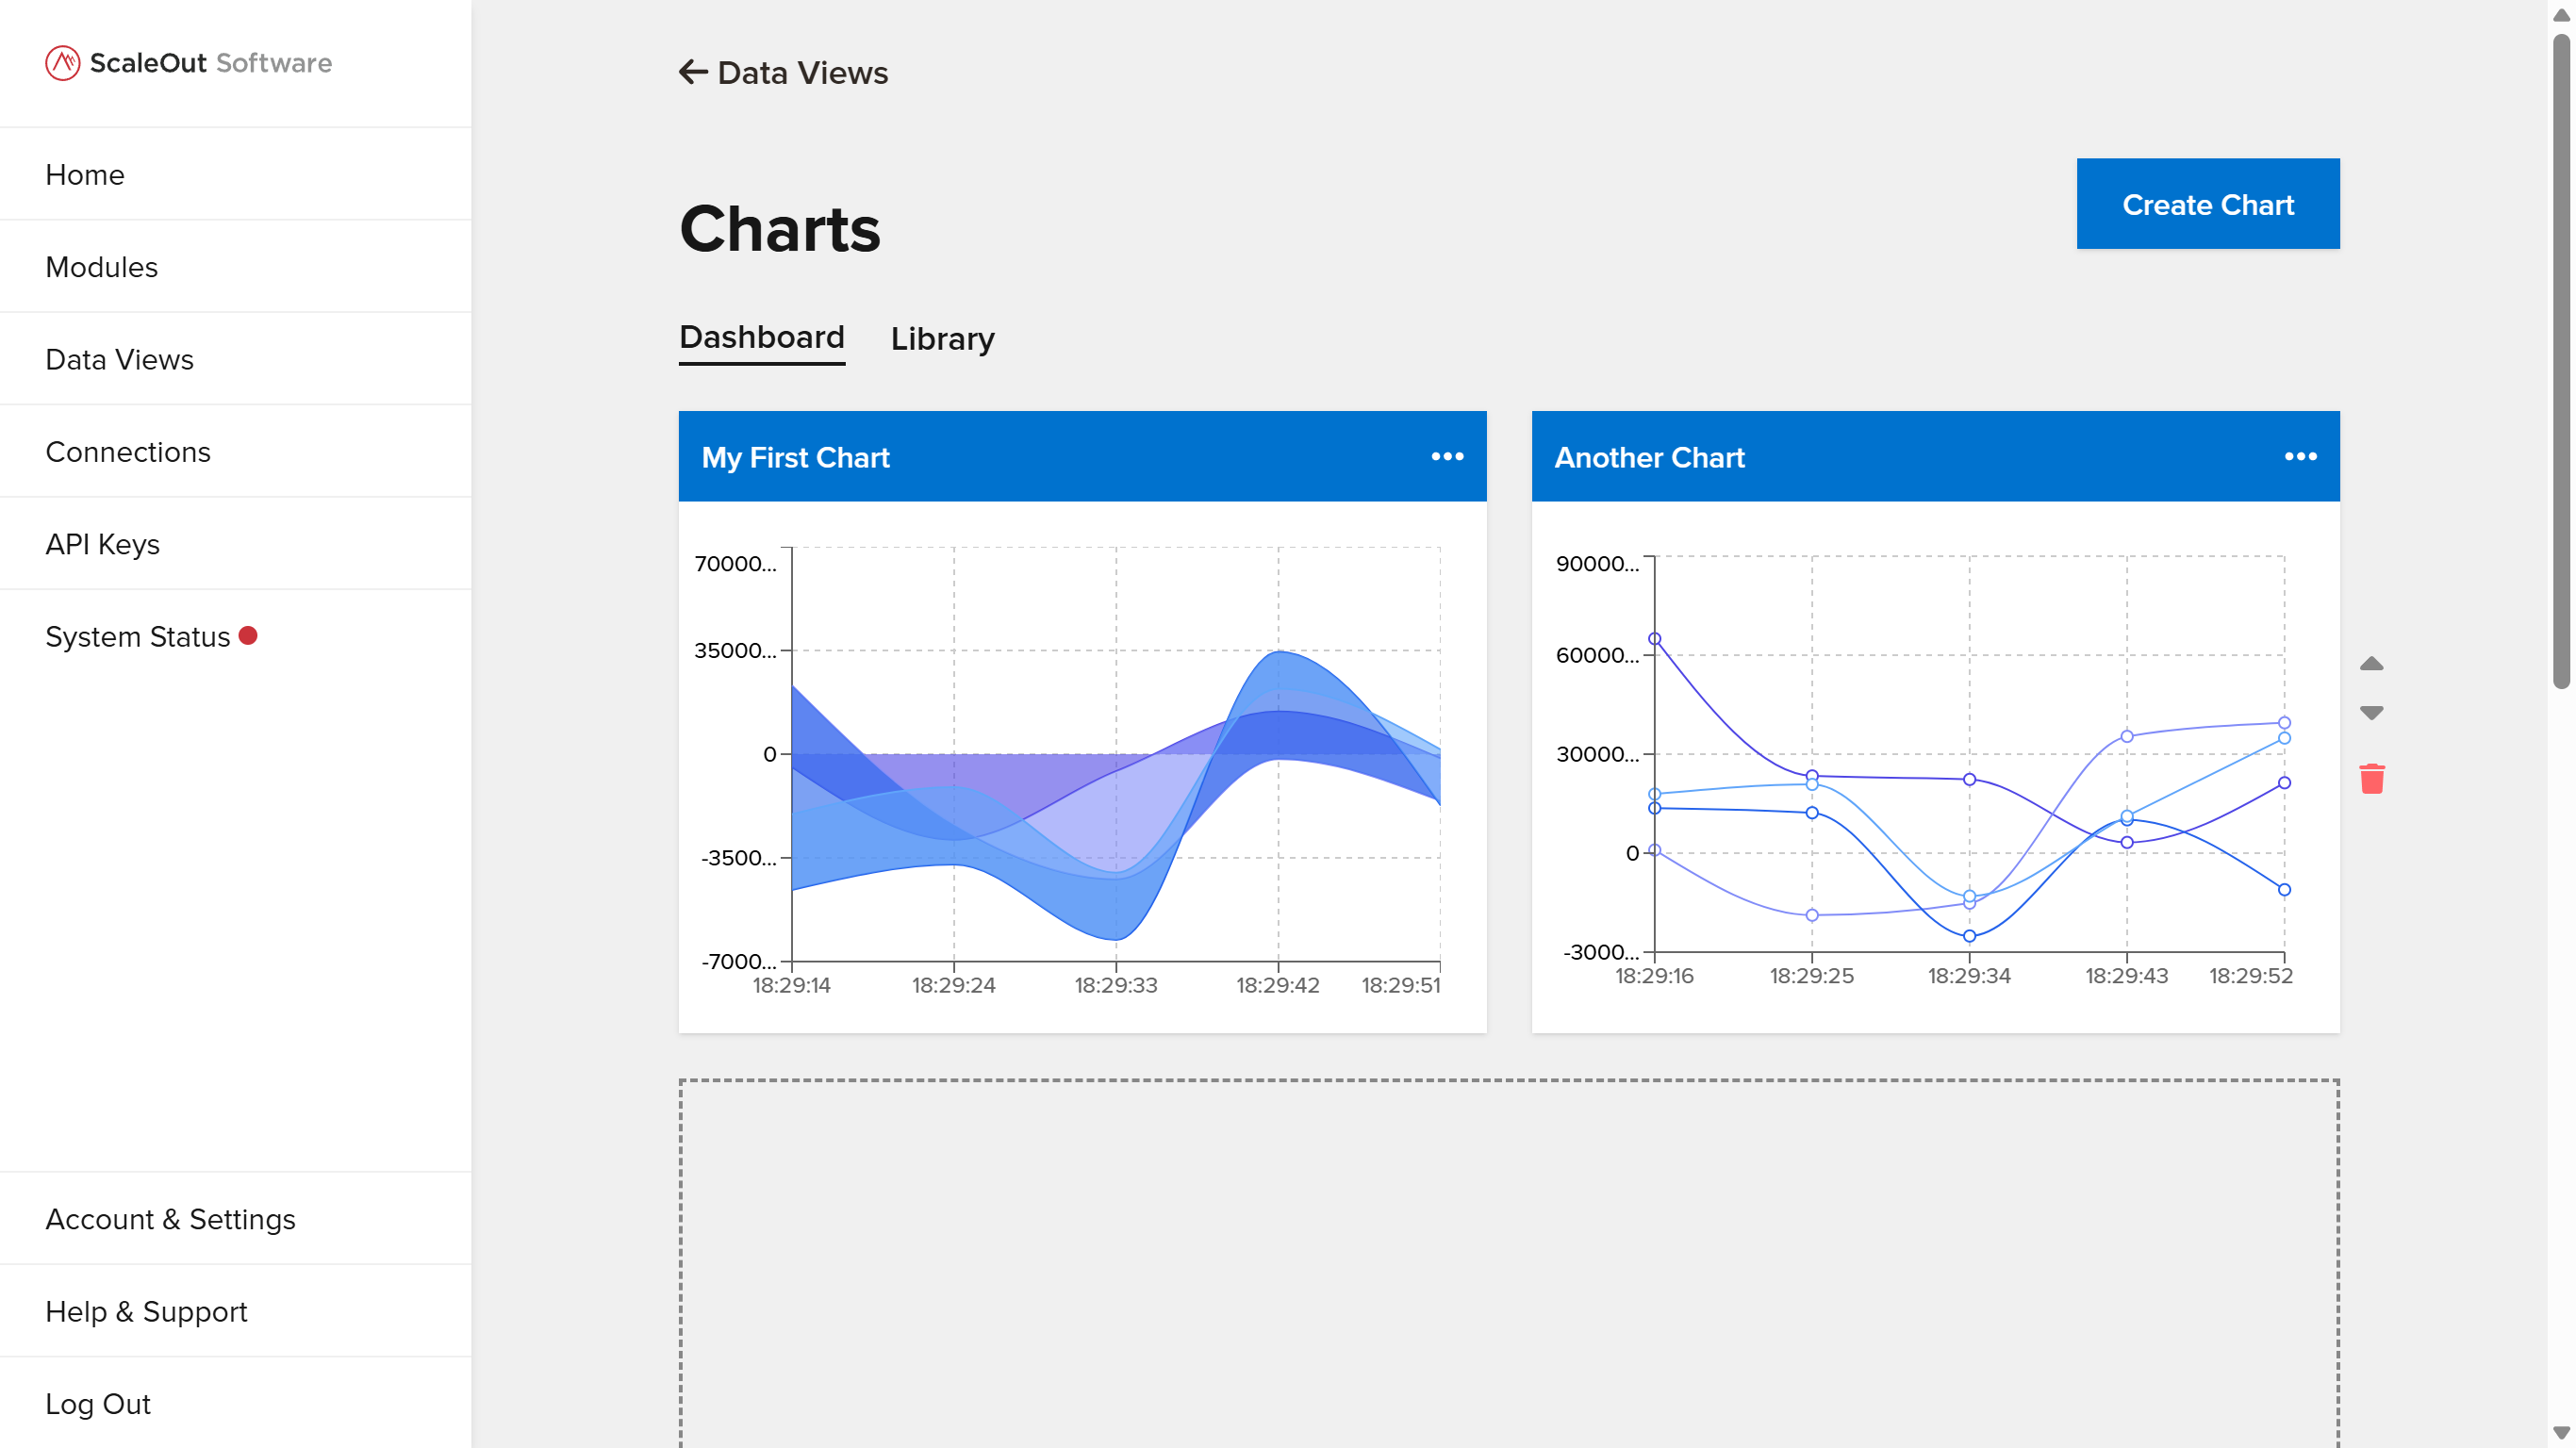
Chart Dashboard
The Chart Dashboard allows you to create a customizable real-time dashboard with your most important charts. Access the dashboard by going to the Data Views page and clicking the Chart Dashboard link.
Adding Charts to the Dashboard
To add charts to your dashboard, first add a row of 1, 2, or 3 empty slots by clicking the corresponding button. Then, in the space where you would like to place a chart, click either Add Chart from Library to add an existing chart, or Add New Chart to create a new chart.
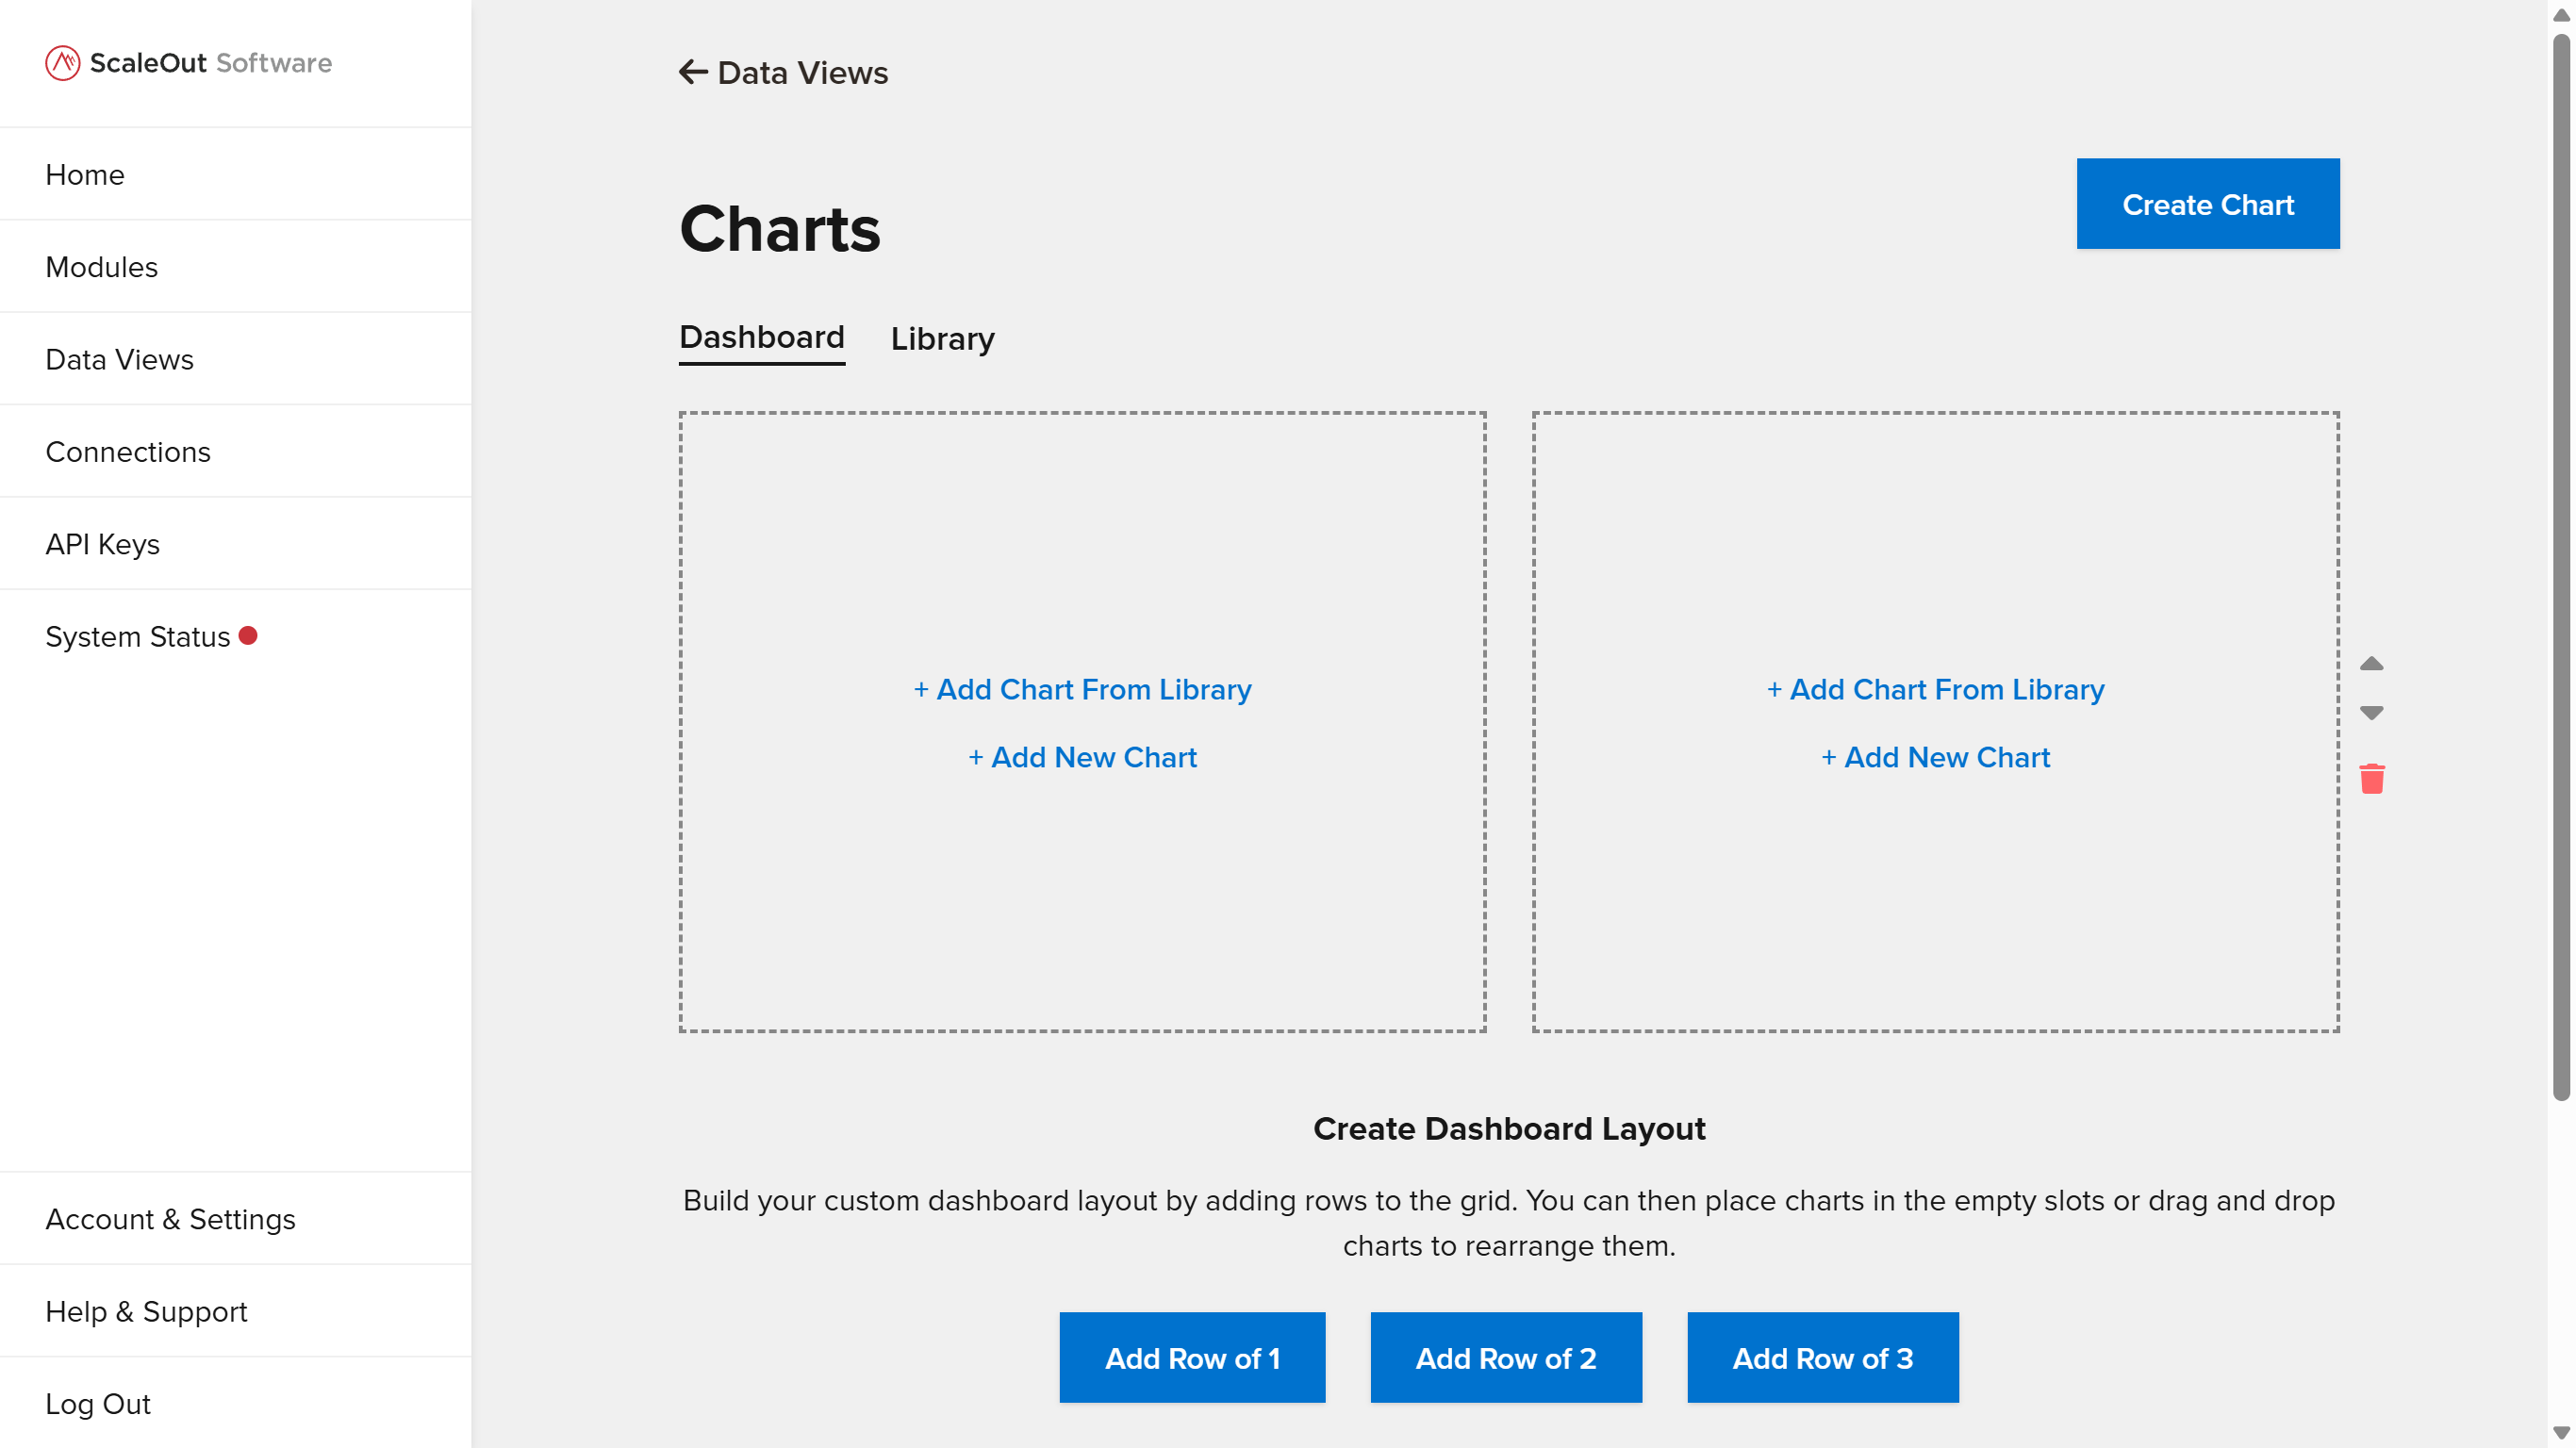
Select or create a chart, and it will appear in the selected space. Aggregated data may initially take a few seconds to display.
Note
At smaller screen resolutions, all charts will display in a single column regardless of row size.
Rearranging the Dashboard
You can rearrange the dashboard by dragging and dropping individual charts, reordering rows, and deleting rows.
To move a single chart, hover over the title and a drag-and-drop cursor will appear. Click and hold, then drag the chart to an empty slot and release to place it.
To rearrange rows, use the up and down arrows on the right side of the row. To delete a row, click the trash can icon on the right side of the row. When deleting a row, you can also choose whether to permanently delete its charts or to keep them in your library.
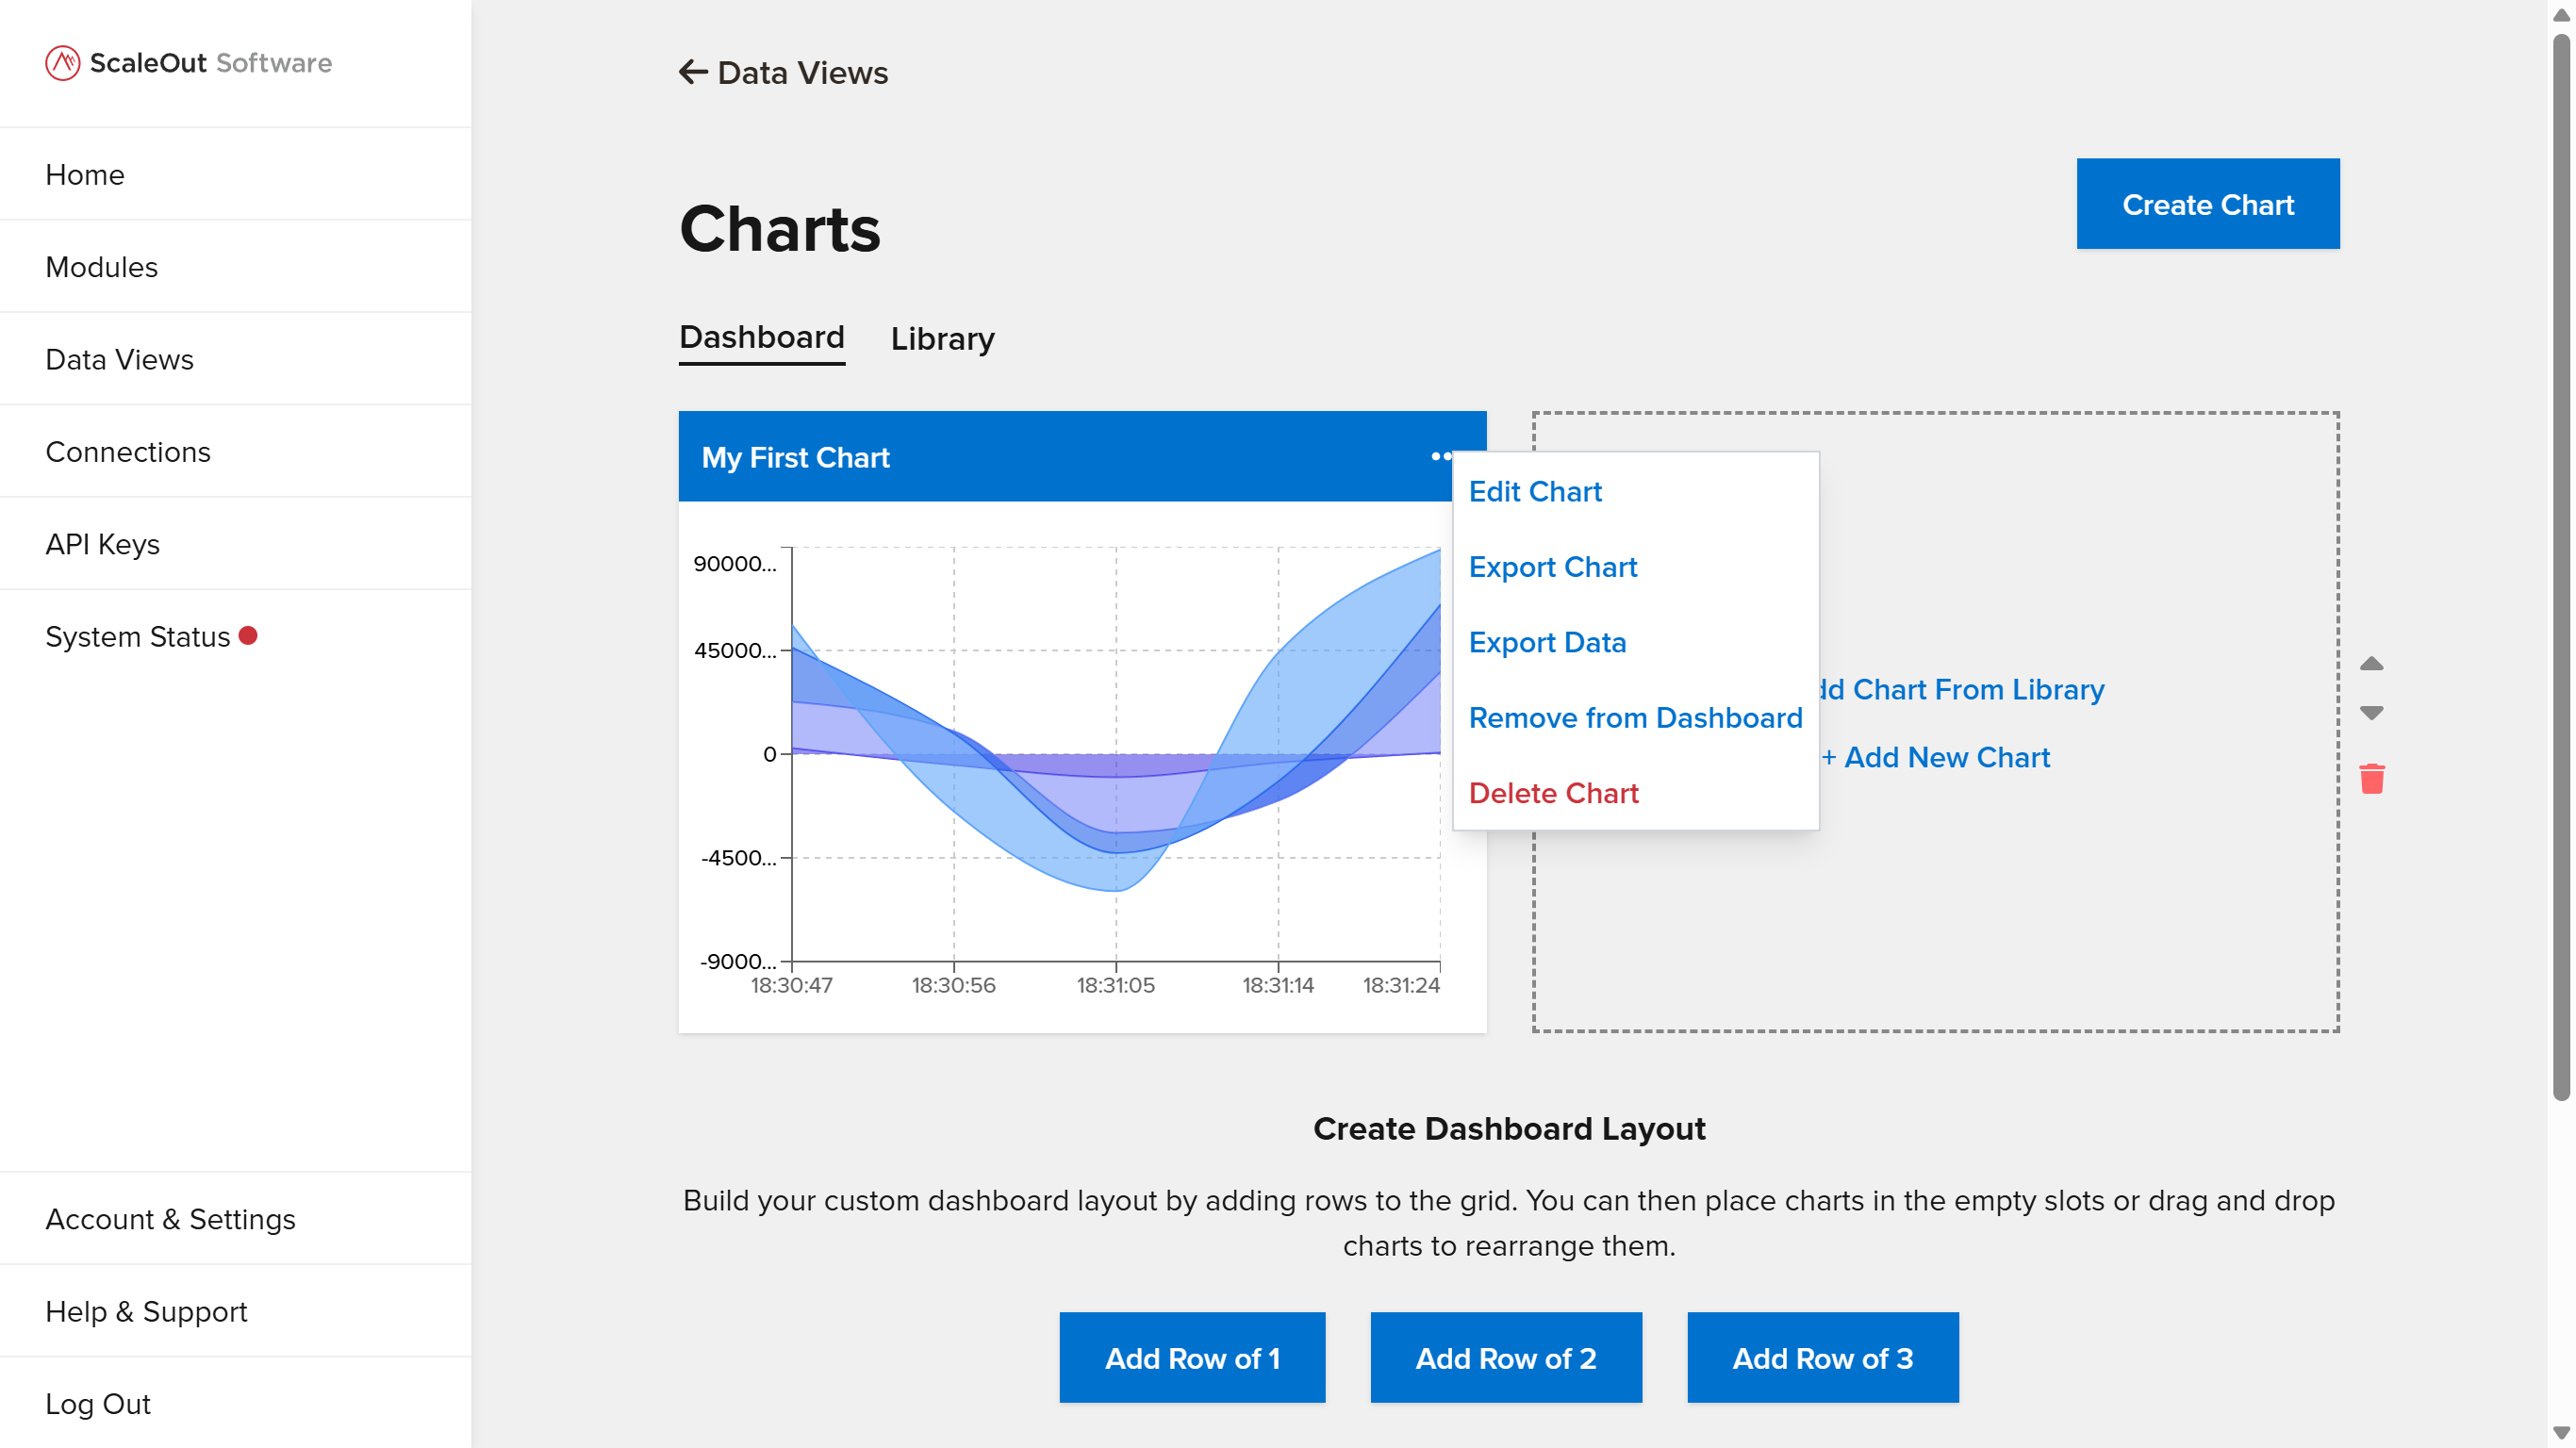
Managing Charts from the Dashboard
You have the option to manage charts directly from the dashboard. Click on the 3 dots icon on the top right corner of a chart to bring up management options. You can then choose to edit the chart, export it as JSON, export its data as JSON, remove it from the dashboard, or delete it.
Queries
You can create queries to select subsets of your module data and display the results in a table or on a map.
Creating a Query
To create a query, first navigate to the Data Views page. To access the query builder form, either click Add Data View and switch to the Query tab, or click the Create Query link under the list of options for queries.
To complete the form, first give the query a title and select a module to query. In the table below, choose the properties for the query to select by checking the boxes.
You can optionally add a where clause to filter the data retrieved by the query. For more about how to use where clauses, see the section on Where Clauses above.
Note
You don’t need to select properties in order to use them in a where clause. For example, you could create a where clause to filter by a Region property but only select Temperature and Speed properties in your query.
Finally, select your preferences for the remaining query options:
Limit Results: check the box and enter a number to specify the maximum number of results a query should return. Alternatively, uncheck the box to return all results (this may affect performance).Enable Map View: check the box to allow the results to display on a map. See important Note below regarding map view.Continuously Update Results: check the box to update results every 5-10 seconds. If unchecked, results will not update unless manually refreshed.
Note
Enabling Map View
In order to use map view, you must provide your own ArcGIS developer API key. You can obtain a free key at https://developers.arcgis.com/. You can then use this key in the UI by going to Account & Settings > Connected Services in the UI and saving the key.
In addition, map queries must have a Latitude and Longitude property selected in order to plot the results on the map.
To finish creating the query, click the Add Query button, or click Cancel to go back without creating the query.
Viewing Query Results
To view query results, navigate to the Data Views page and click the Query Results link under the options for Queries.
Table Queries
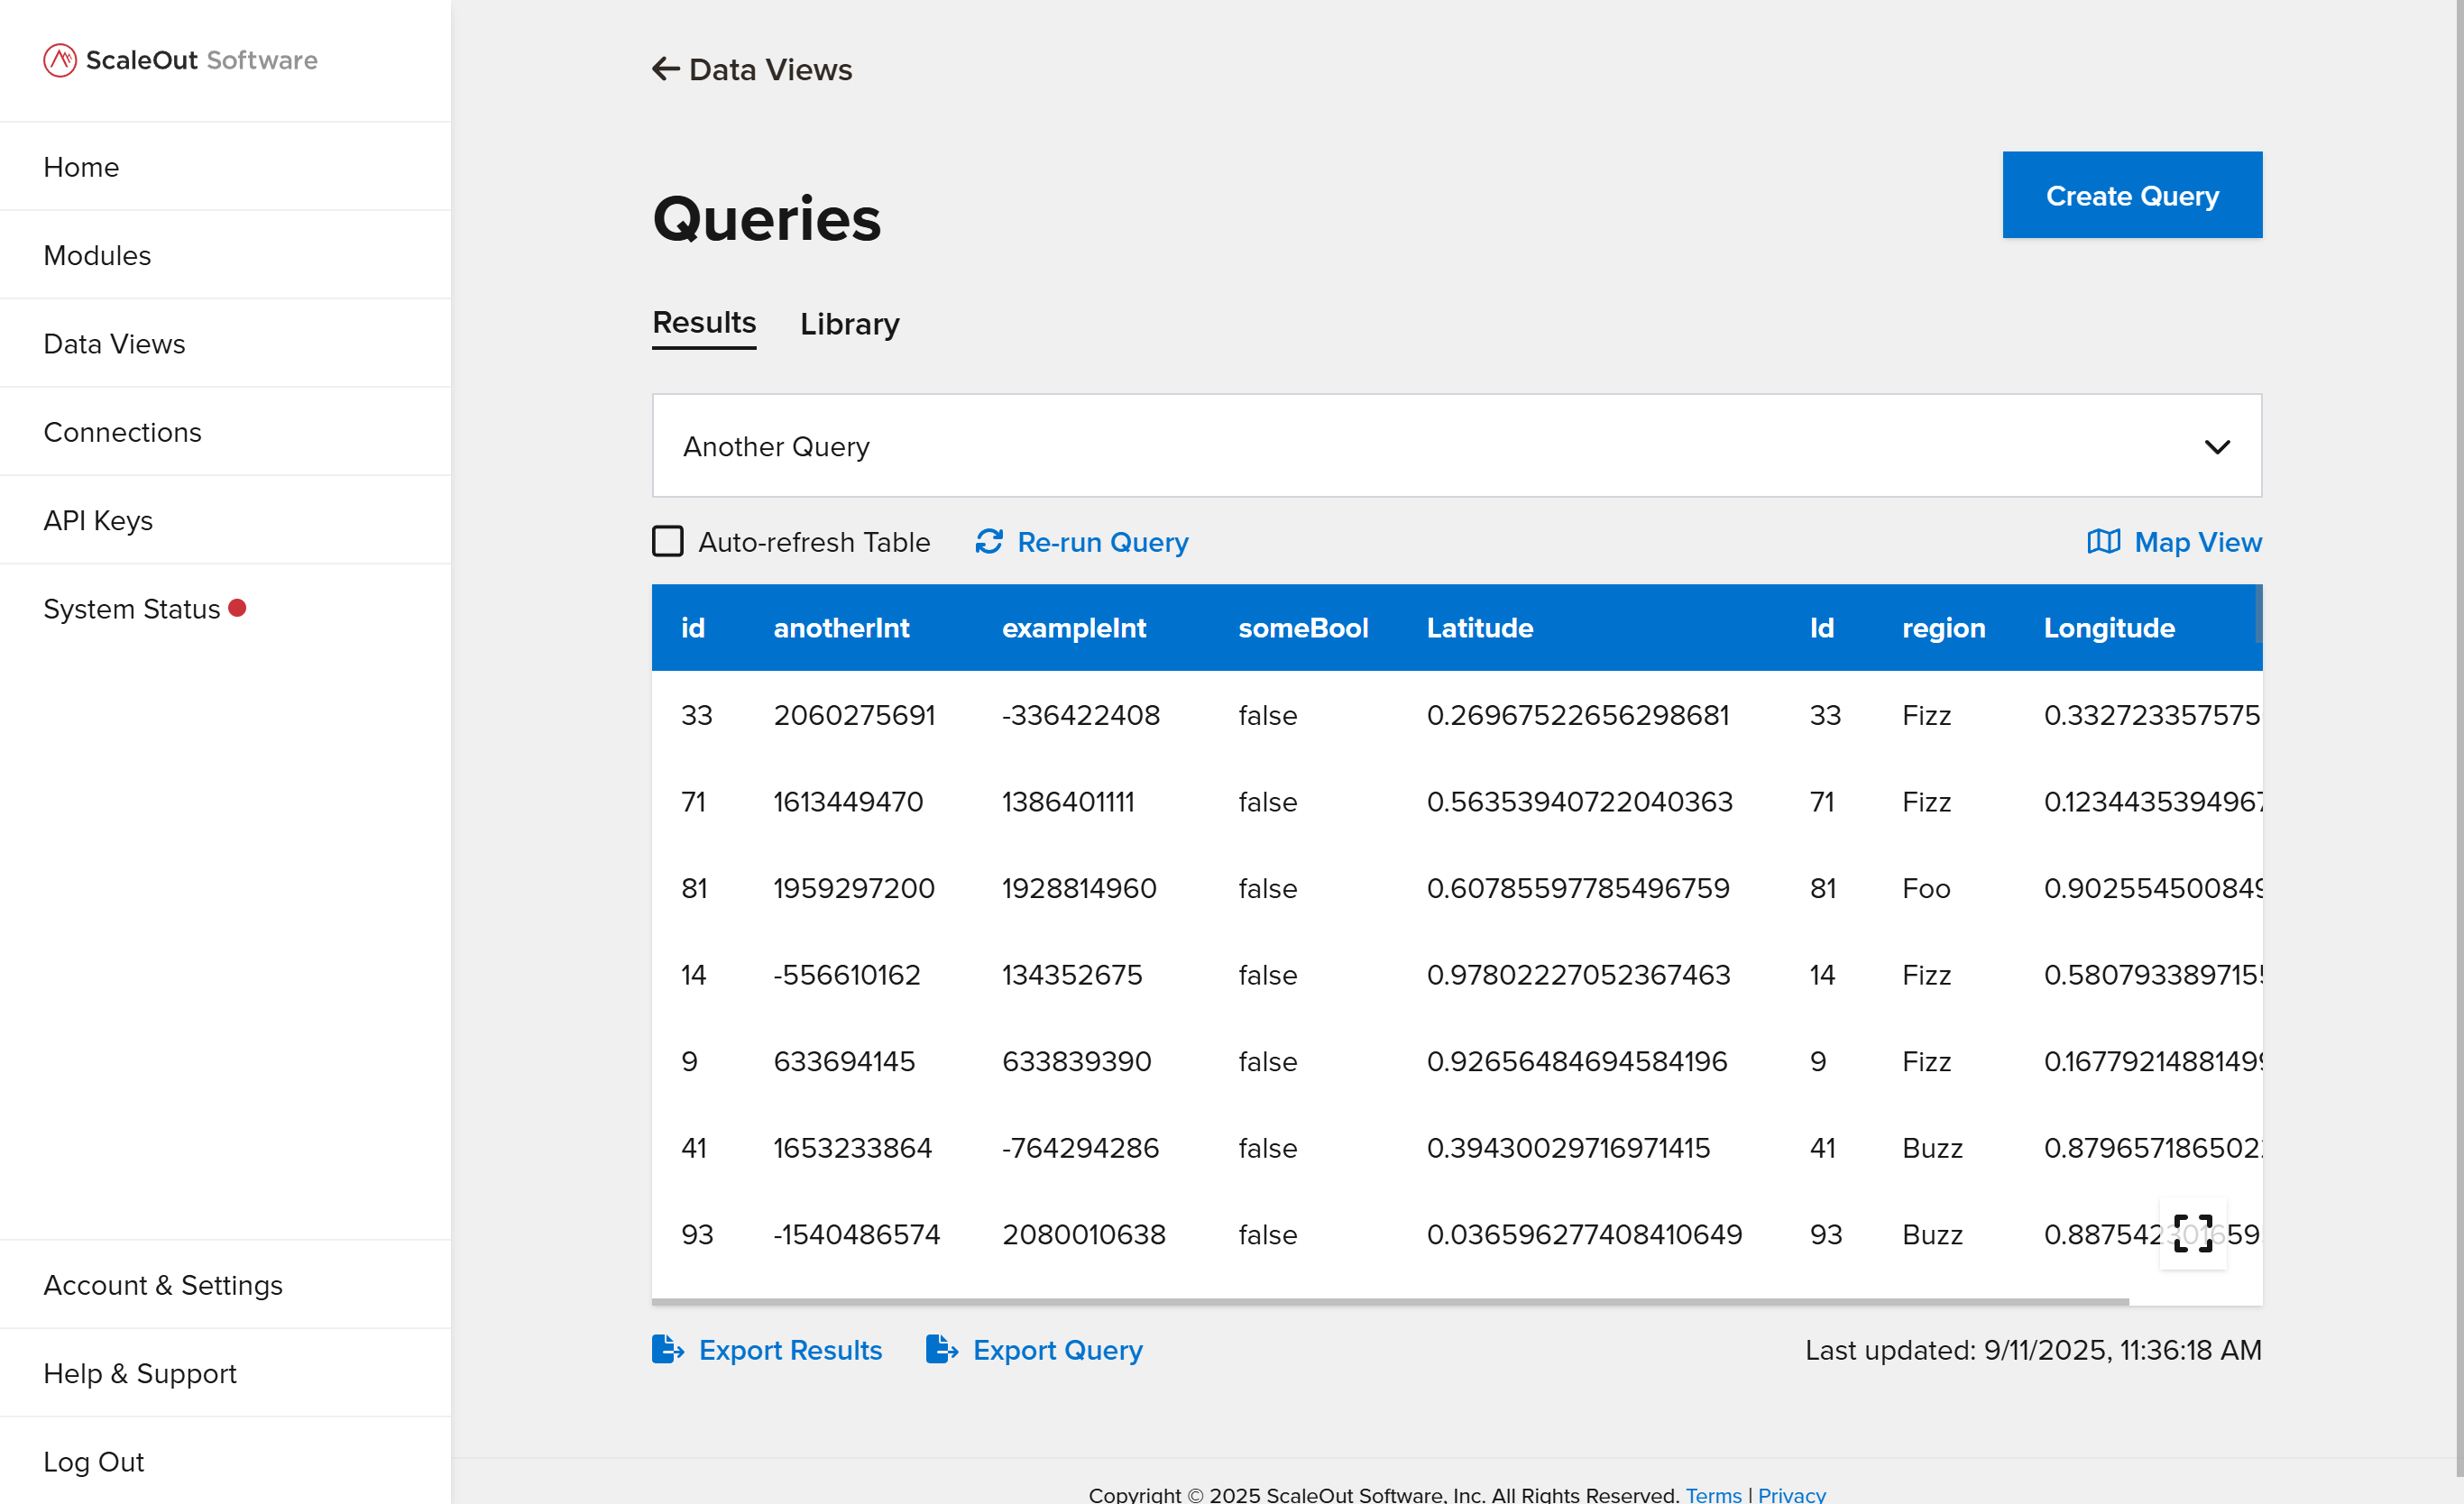
Queries are shown in table view by default. Select a query to view from the dropdown list, and results will be displayed in the table.
You can sort the table by columns and click the expander icon in the bottom right to make the table fullscreen (click the icon again to exit fullscreen view).
To re-run the query, click the Re-run Query button above the table. If you would like the table to refresh automatically every few seconds, check the Auto-refresh Table box. The time the query was last refreshed is shown to the bottom right of the table.
You can also export the query and its results as JSON. To do this, click the Export Query or Export Results buttons below the table.
Map Queries
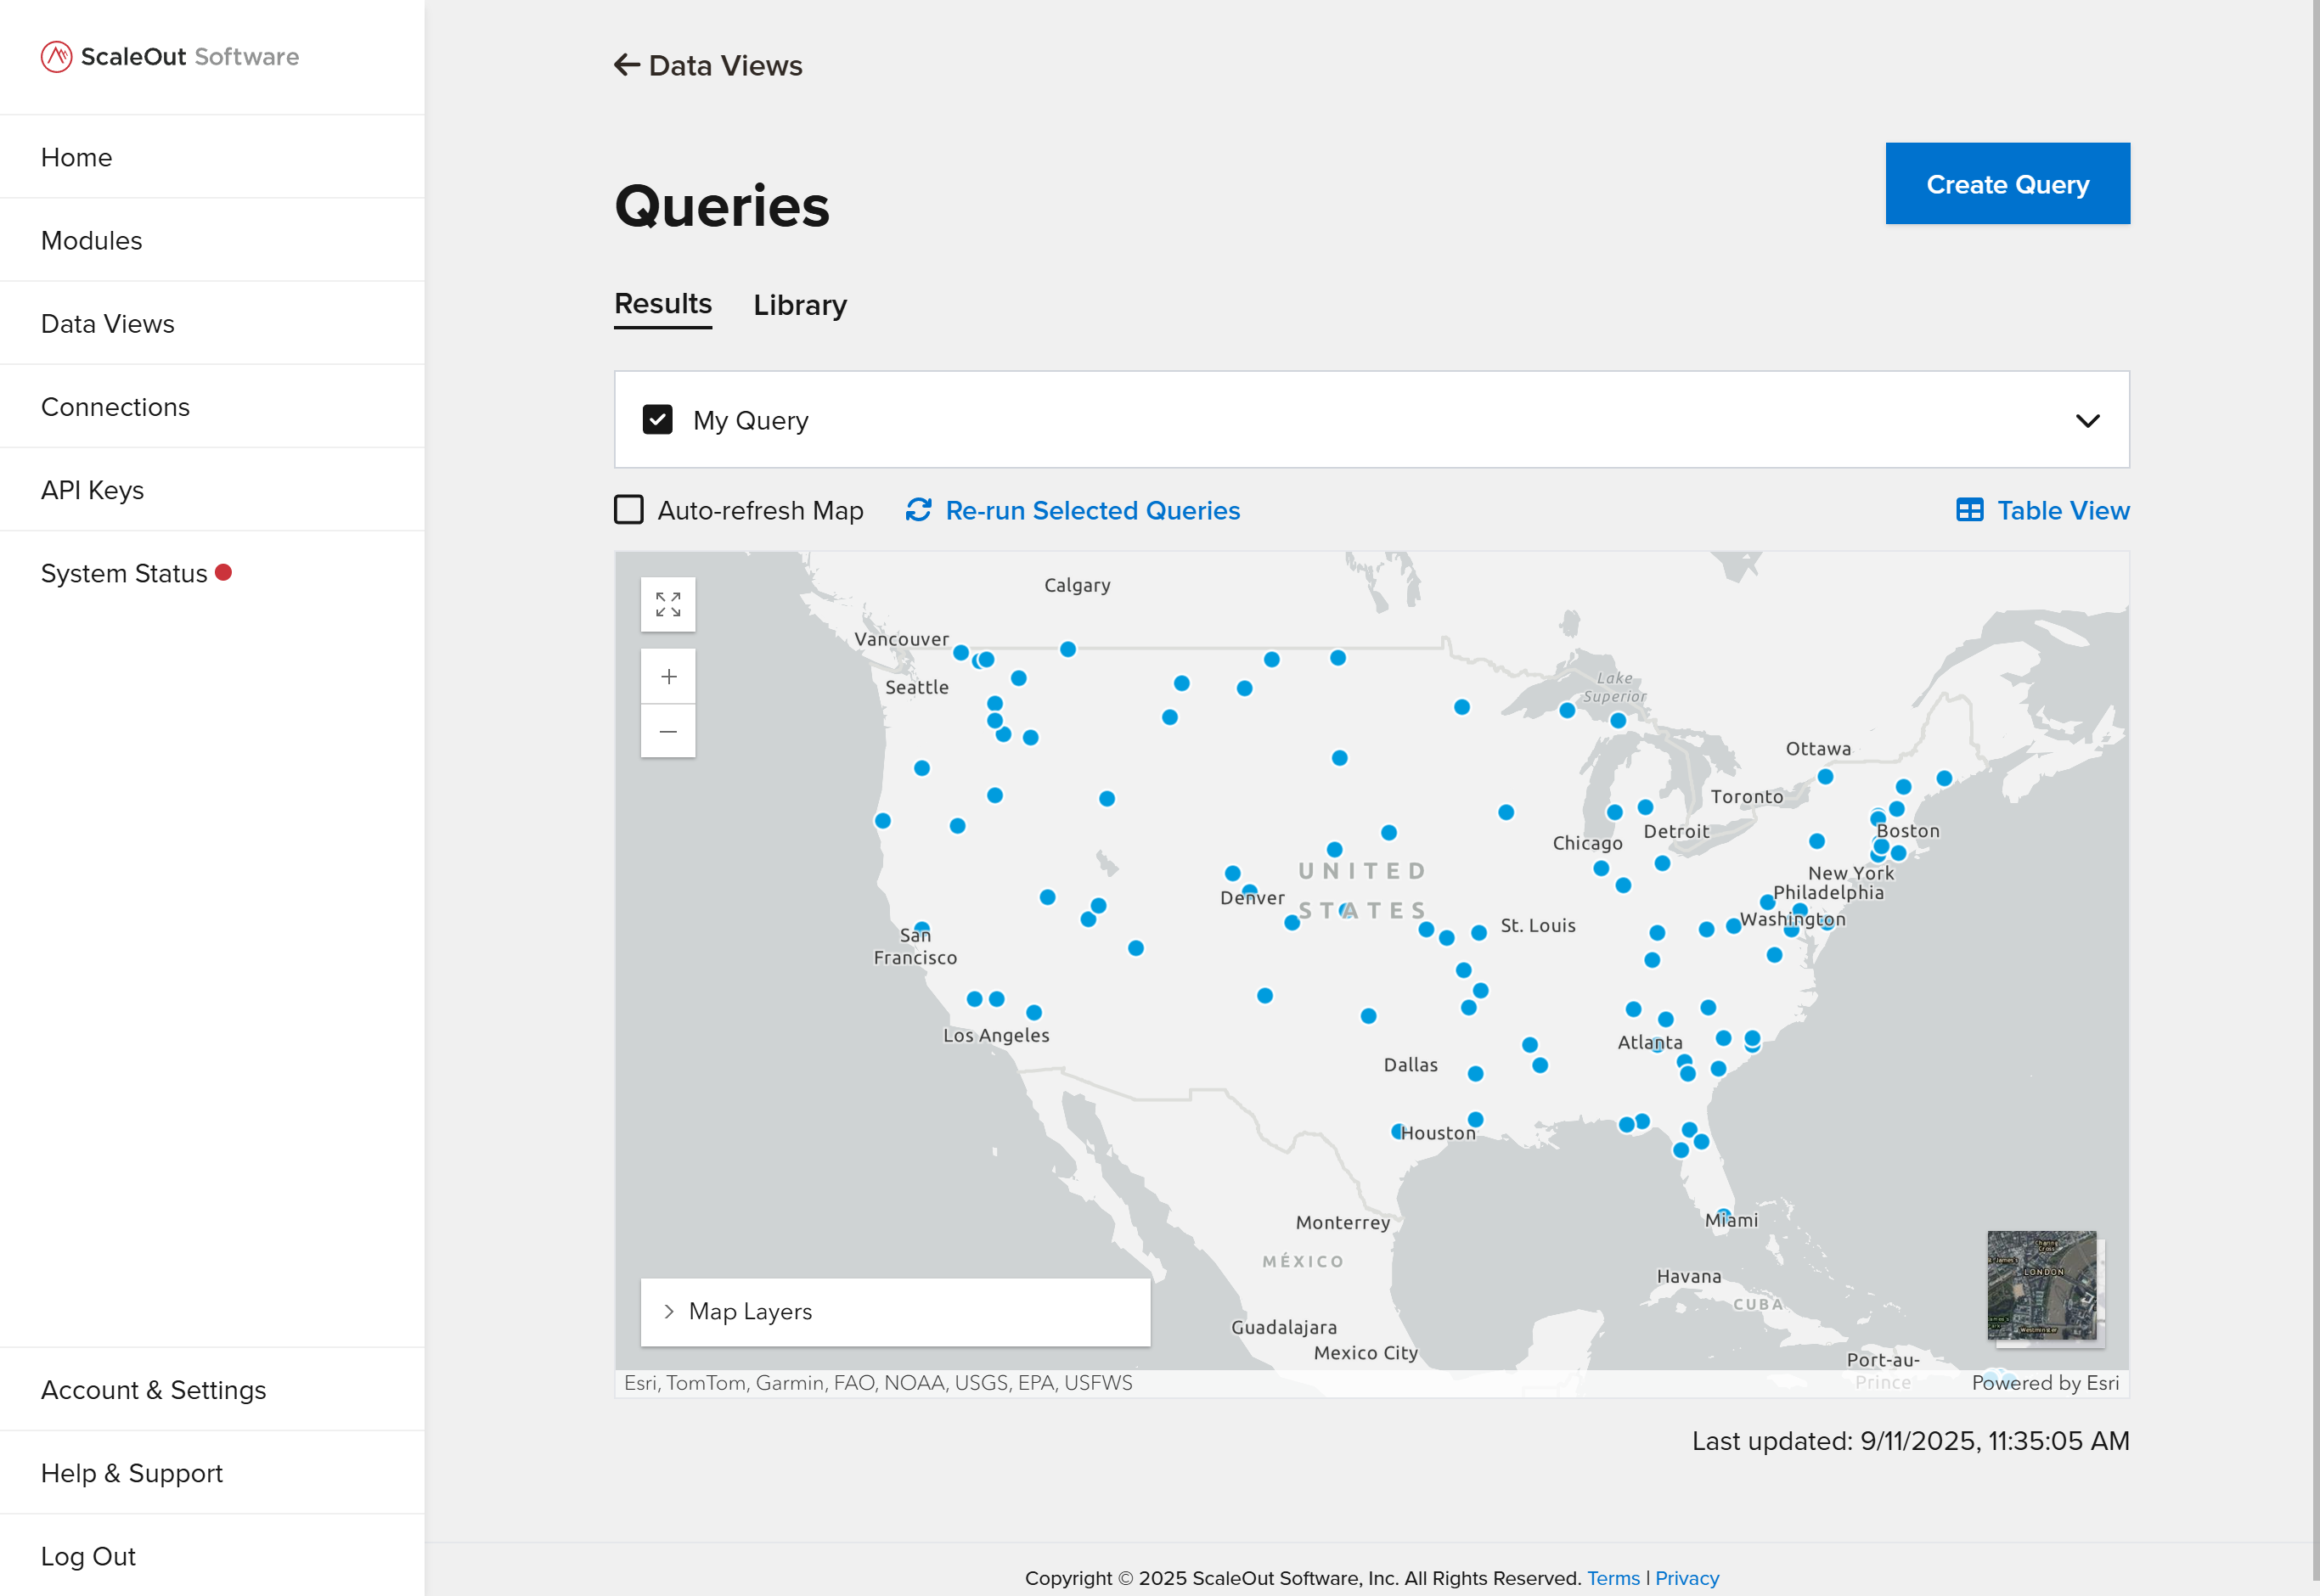
To switch to map view from table view, click the Map View button to the upper right of the table.
Any map queries you have created will appear in the dropdown list above the map. Select any queries you would like to display by checking the boxes. You can select more than one query.
You can use the built-in map controls to interact with the map:
To view details about a data point, click the icon on the map to bring up a details panel.
To show or hide queries, first expand the map layer list in the bottom left, then click the eye icon for the corresponding layer.
To reposition the map, click and drag anywhere
To make the map fullscreen, click the fullscreen button at the top left
To zoom in or out, use the plus and minus icons at the top left
To toggle the map style, click on the basemap switcher at the bottom right
To re-run the selected queries, click the Re-run Selected Queries button above the map. If you would like the map to refresh automatically every few seconds, check the Auto-refresh Map box. The time the map was last refreshed is shown to the bottom right.
Query Library
Once you create a query, it will be available in your Query Library. To access the query library, go to the Data Views page and click the Query Library link. The table displays a list of all queries that are currently in the system.
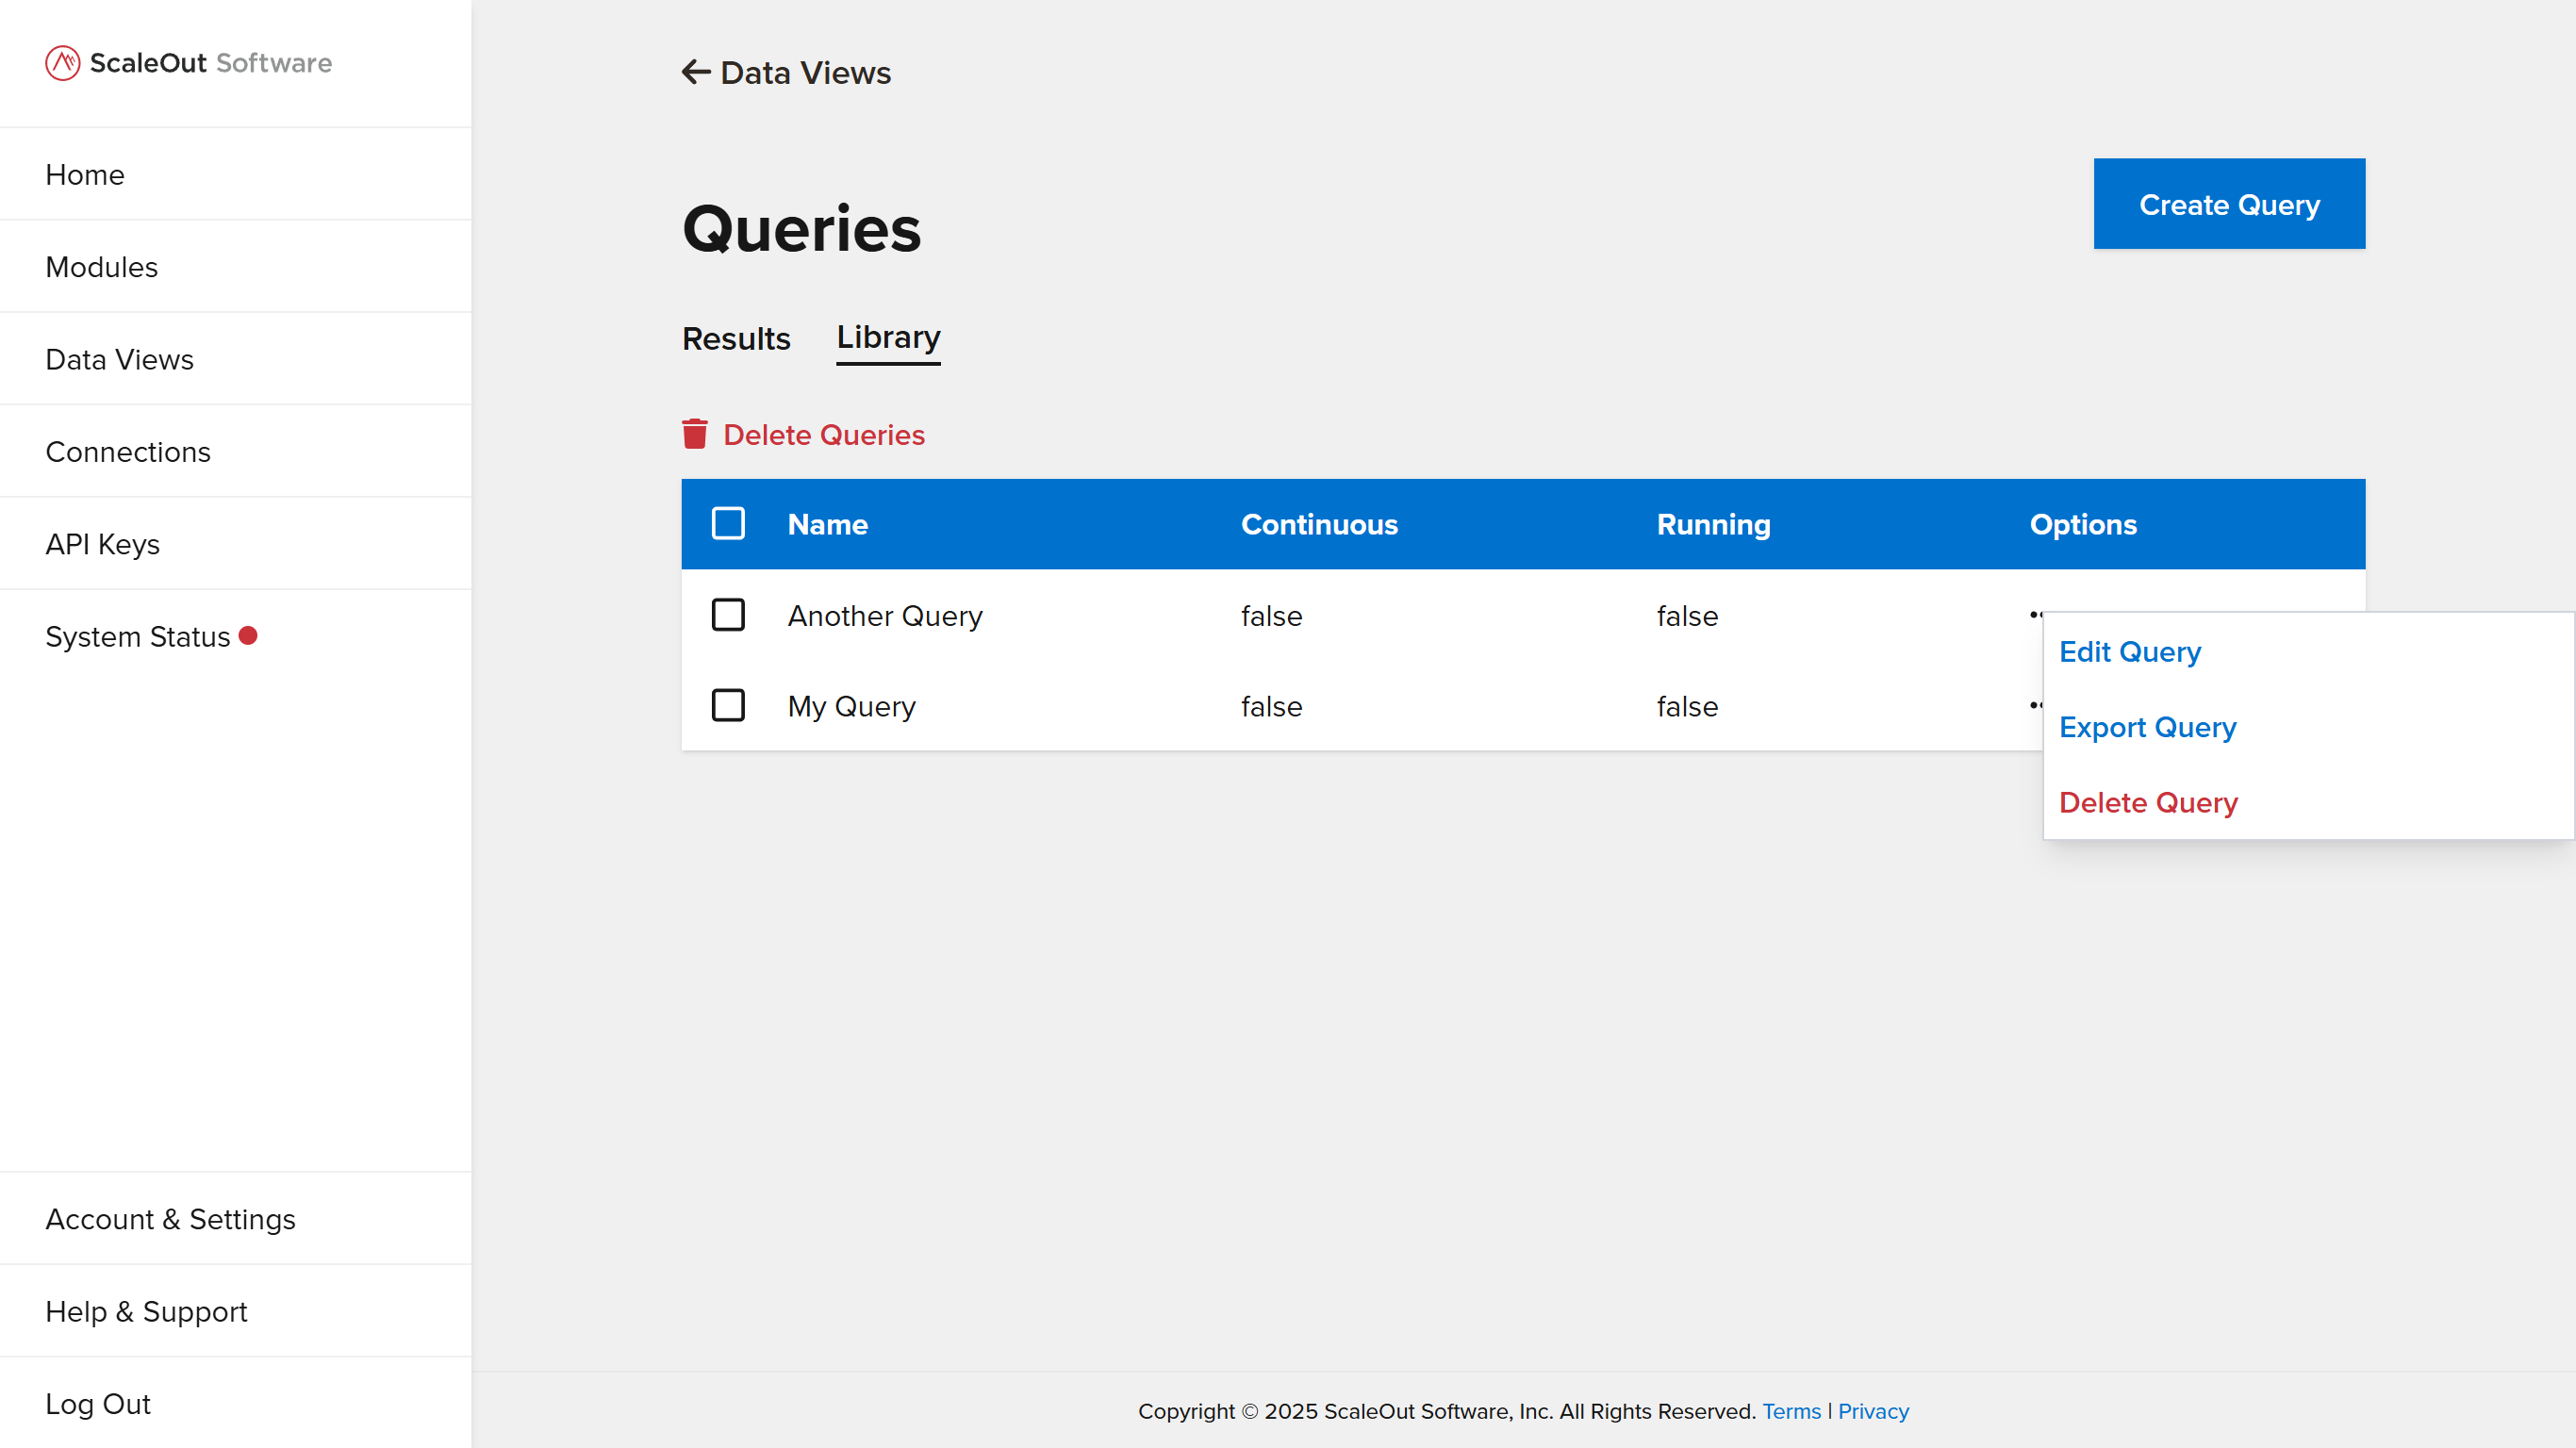
Click the 3 dots icon in the Options column to display options for a given query. You can edit a query, export it as JSON, or delete it from the system. To delete multiple queries at once, select them in the table and click the Delete Queries button above the table.