Trend and Anomaly Detection
Enabling Trend and Anomaly Detection
You can enable trend and anomaly detection for each chart and query you create. Trend and anomaly detection looks at historical data for selected numerical properties of your model, automatically identifying patterns and raising notifications.
Queries
You can enable trend and anomaly detection for queries whether they are manually created or AI-generated.
Manual Queries
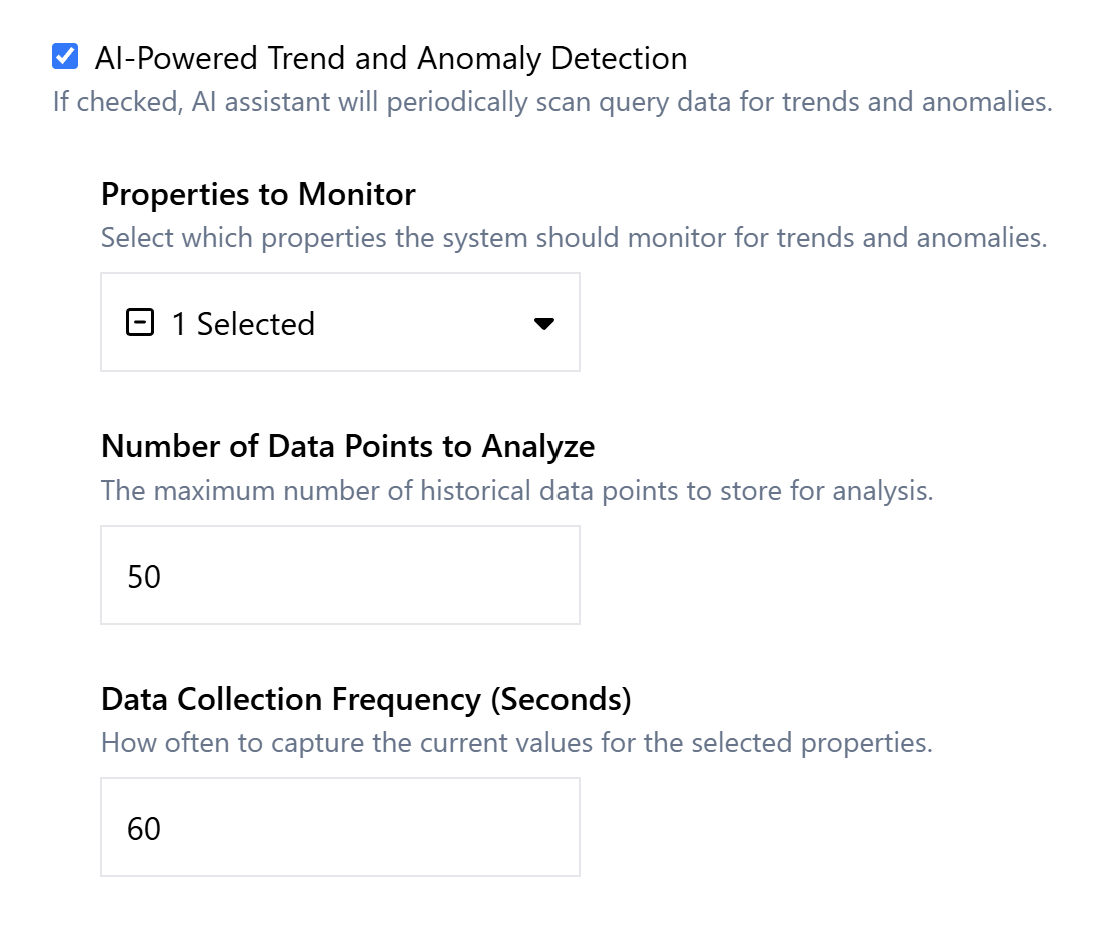
Go to the Build Query page and build a query as usual. To enable trend and anomaly detection, check the AI-Powered Trend and Anomaly Detection checkbox. Three new fields will appear:
Properties to Monitor: The properties of the model to check for trends and anomalies. This is currently limited to numerical properties only. If the list is empty, it means the selected model has no numerical properties and this feature is not available for the model.
Number of Data Points to Analyze: The maximum number of data points for each property to store for analysis. For example, if you input
50, the AI assistant will look at the last 50 saved values when it scans for trends and anomalies.Data Collection Frequency (Seconds): How often to capture the values of the selected properties, from 10 to 3600 seconds. The default value for this field comes from the Default Data Collection Interval setting on the Admin page.
Complete these fields with your preferred settings and press Run Query to run the query with Trend and Anomaly Detection enabled.
Note
Queries that use Trend and Anomaly Detection must be marked as Continuous to enable them to collect data. If a continuous query is stopped, trends and anomalies will not be detected.
AI-Generated Queries
For AI-generated queries, the process for enabling anomaly detection is very similar. Go to the Generate Query page, enter a query prompt, and select a model. To enable trend and anomaly detection, check the AI-Powered Trend and Anomaly Detection checkbox. Three new fields will appear (see above for descriptions). Complete the fields with your preferred settings, then press Generate Query.
Note
Queries that use trend and anomaly detection will be set as Continuous by default.
Charts
As with queries, you can enable trend and anomaly detection for charts whether they are manually created or AI-generated.
Manual Charts
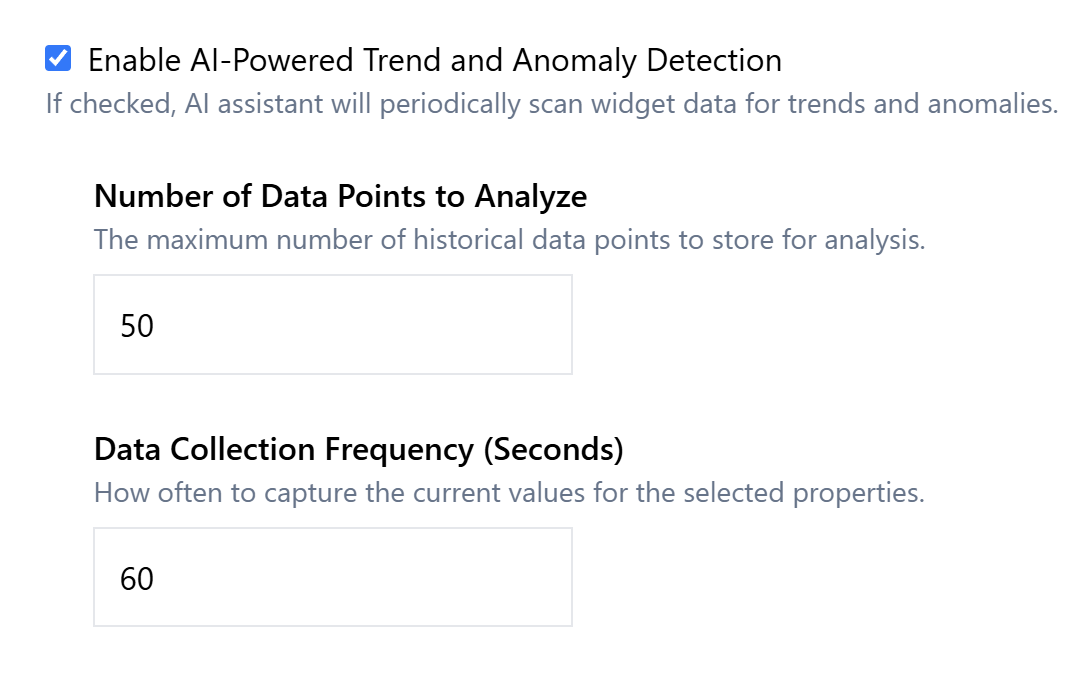
Go to the Dashboard page and create or select an empty slot to add a new chart. To enable anomaly detection, check the AI-Powered Trend and Anomaly Detection checkbox. Two new fields will appear:
Number of Data Points to Analyze: The maximum number of data points for each property to store for analysis. For example, if you input
50, the AI assistant will look at the last 50 saved values when it scans for trends and anomalies.Data Collection Frequency (Seconds): How often to capture the values of the selected properties, from 10 to 3600 seconds. The default value for this field comes from the Default Data Collection Interval setting on the Admin page.
Complete these fields with your preferred settings and press Create Chart.
Note
Unlike queries, charts have no option to select multiple model properties to monitor for trends and anomalies. This is because charts track only one property at a time.
AI-Generated Charts
For AI-generated charts, the process for enabling anomaly detection is very similar. Go to the Generate Chart tab, enter a prompt, and select a model. To enable trend and anomaly detection, check the AI-Powered Trend and Anomaly Detection checkbox. Two new fields will appear (see above for descriptions). Complete the fields with your preferred settings, then press Generate Chart.
Viewing Trends and Anomalies
When the AI Assistant detects trends and anomalies in your query and chart data, it will report those findings on the Insights page. This page provides a feed of all AI Assistant activity, including trend/anomaly detection and AI-generated queries and charts.
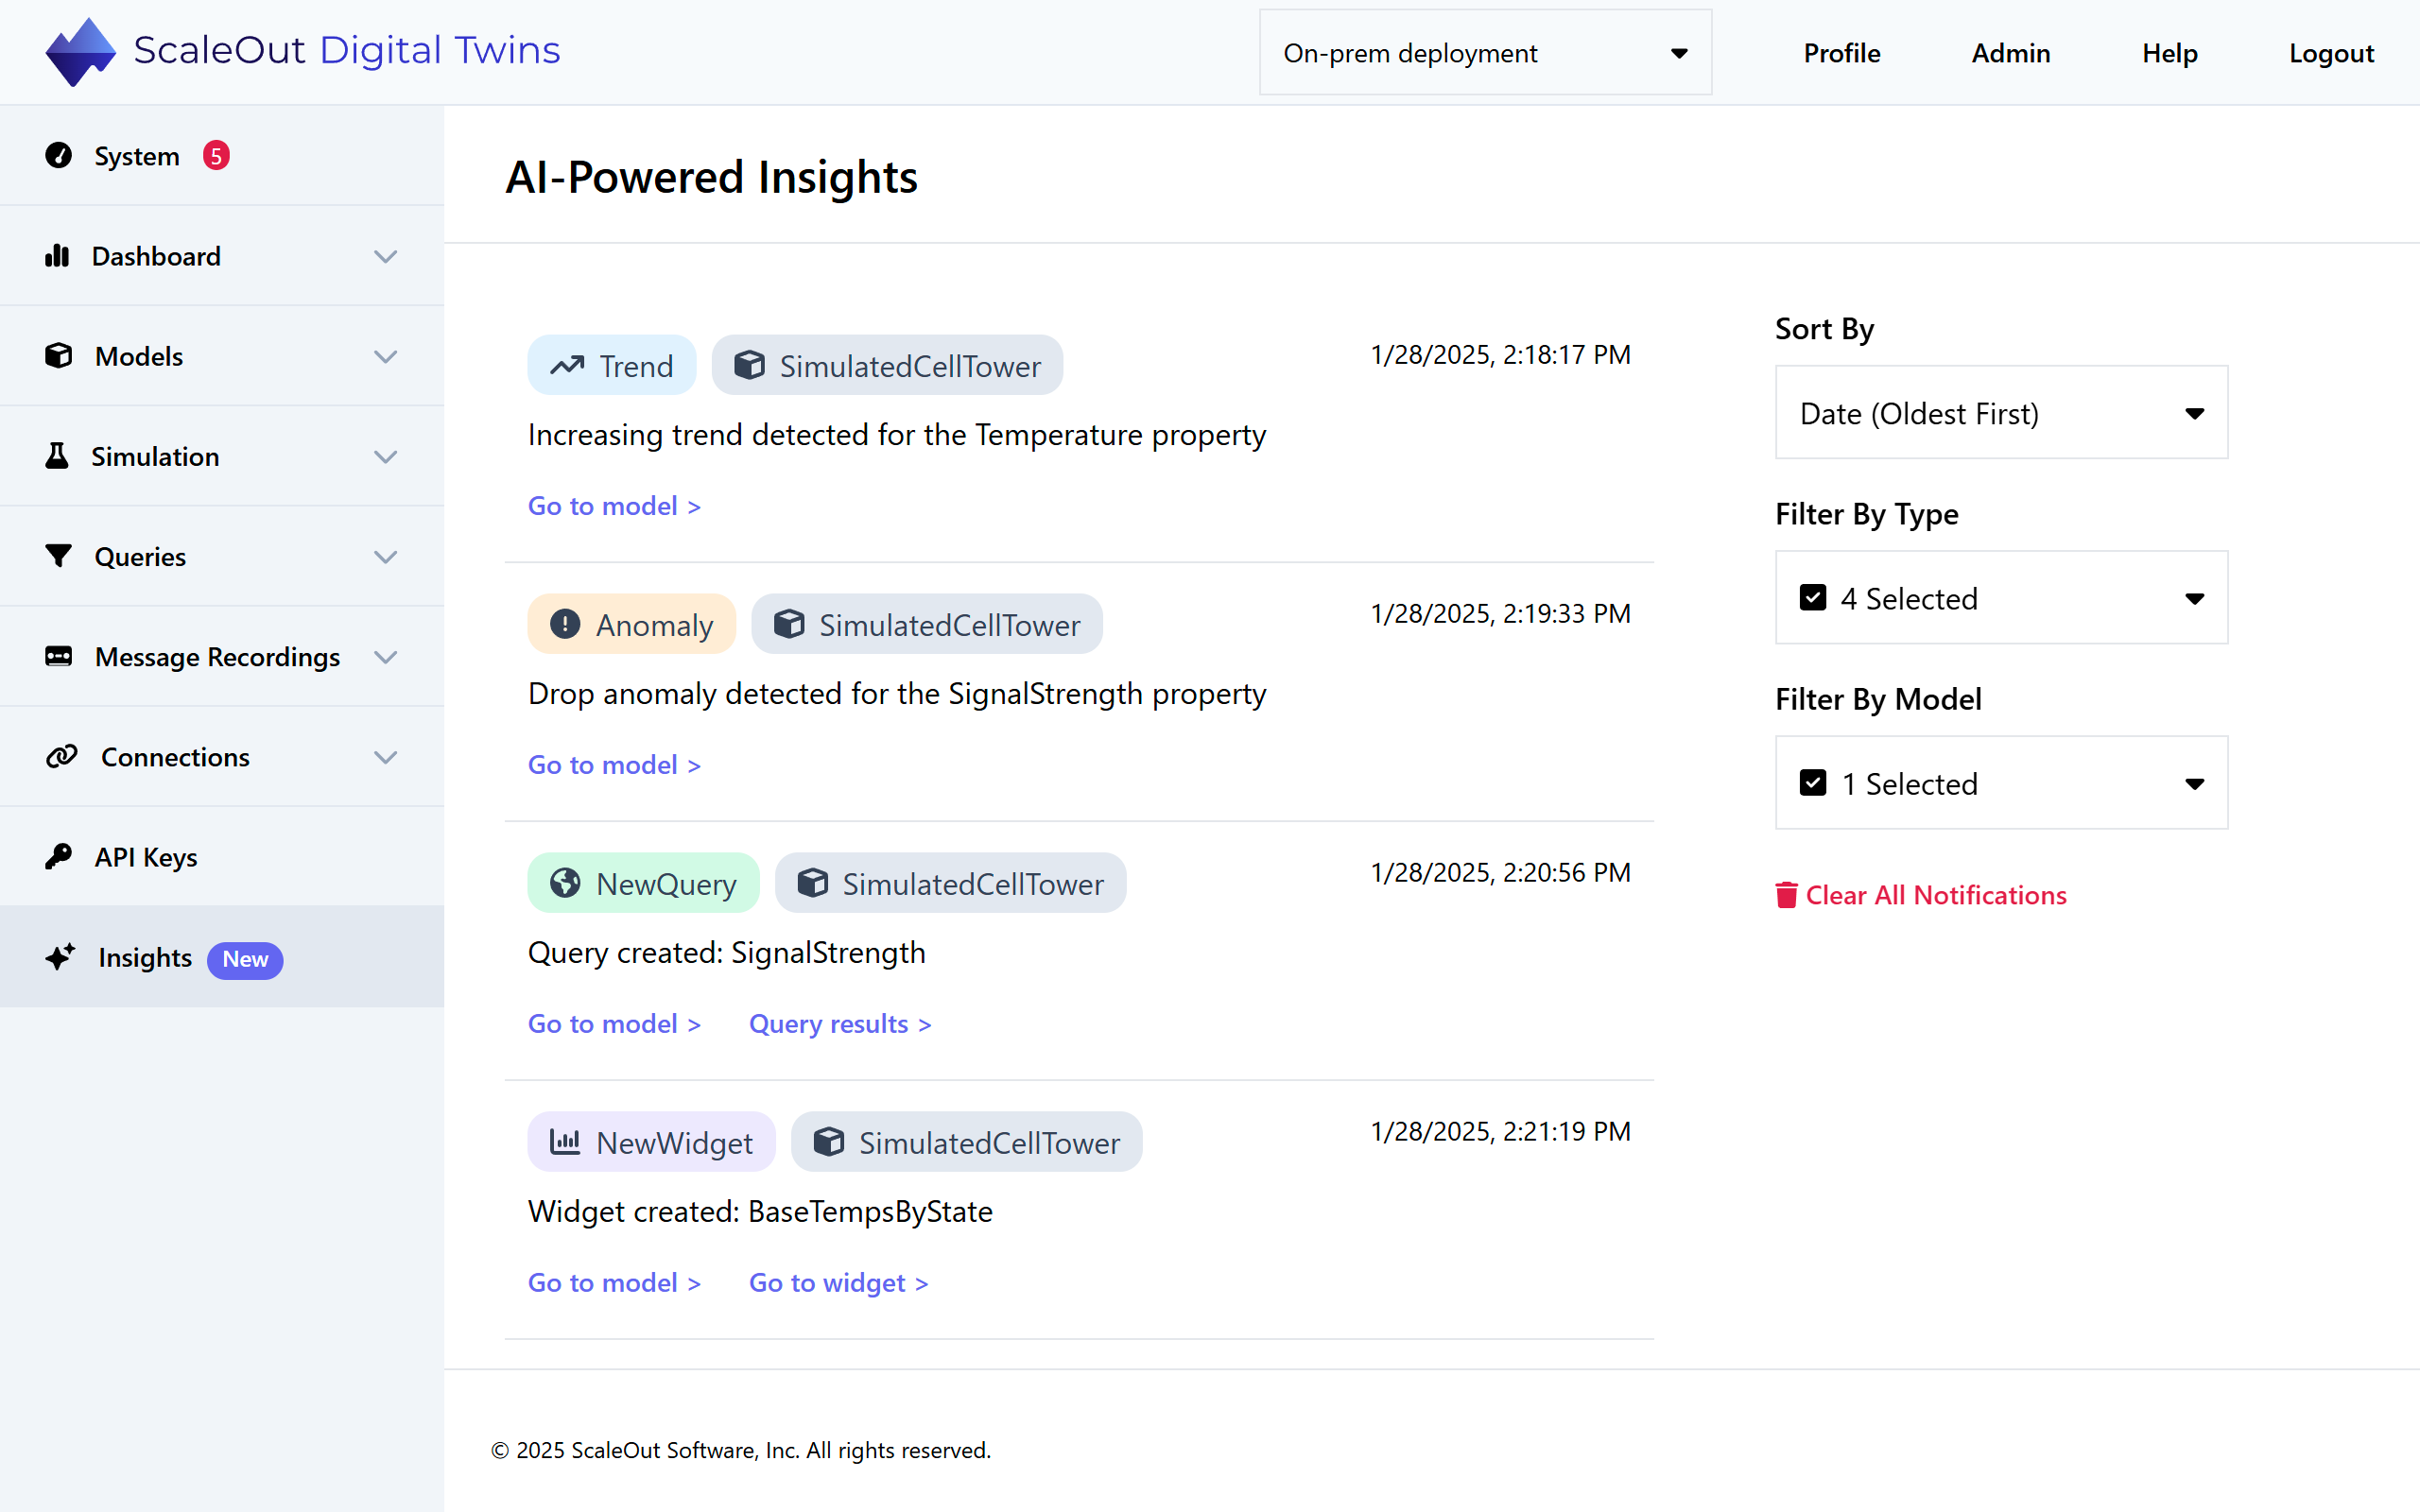
Each notification shows its type, associated model, and date it was issued. To jump to the model details, click the Go to Model > link at the bottom. If the notification is associated with a chart or query, click Go to Chart > or Query Results > to jump to the chart/query details.
You can use the filters to customize which notifications are shown on the feed:
Sort By: Choose from 4 sort options: Date (newest first), date (oldest first), digital twin model, or notification type.
Filter By Type: Choose a subset of notification types to show. For example, if you only want to see trends and anomalies, deselect New Query and New Chart.
Filter By Model: Show notifications for the selected model(s) only.
To delete all notifications from the feed, click the Clear All Notifications button on the right.